Ultima Markets App
Trade Anytime, Anywhere
Important Information
This website is managed by Ultima Markets’ international entities, and it’s important to emphasise that they are not subject to regulation by the FCA in the UK. Therefore, you must understand that you will not have the FCA’s protection when investing through this website – for example:
- You will not be guaranteed Negative Balance Protection
- You will not be protected by FCA’s leverage restrictions
- You will not have the right to settle disputes via the Financial Ombudsman Service (FOS)
- You will not be protected by Financial Services Compensation Scheme (FSCS)
- Any monies deposited will not be afforded the protection required under the FCA Client Assets Sourcebook. The level of protection for your funds will be determined by the regulations of the relevant local regulator.
Note: Ultima Markets is currently developing a dedicated website for UK clients and expects to onboard UK clients under FCA regulations in 2026.
If you would like to proceed and visit this website, you acknowledge and confirm the following:
- 1.The website is owned by Ultima Markets’ international entities and not by Ultima Markets UK Ltd, which is regulated by the FCA.
- 2.Ultima Markets Limited, or any of the Ultima Markets international entities, are neither based in the UK nor licensed by the FCA.
- 3.You are accessing the website at your own initiative and have not been solicited by Ultima Markets Limited in any way.
- 4.Investing through this website does not grant you the protections provided by the FCA.
- 5.Should you choose to invest through this website or with any of the international Ultima Markets entities, you will be subject to the rules and regulations of the relevant international regulatory authorities, not the FCA.
Ultima Markets wants to make it clear that we are duly licensed and authorised to offer the services and financial derivative products listed on our website. Individuals accessing this website and registering a trading account do so entirely of their own volition and without prior solicitation.
By confirming your decision to proceed with entering the website, you hereby affirm that this decision was solely initiated by you, and no solicitation has been made by any Ultima Markets entity.
I confirm my intention to proceed and enter this website Please direct me to the website operated by Ultima Markets , regulated by the FCA in the United KingdomWhat is SMT Divergence in Trading?
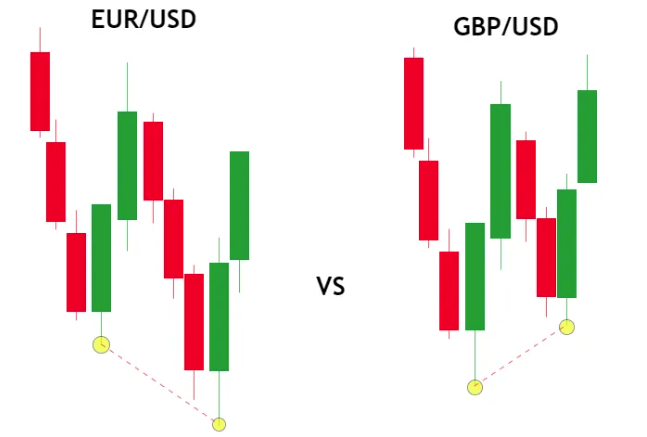
SMT Divergence in Trading occurs when two correlated assets show different behavior at key highs or lows. For example, if EUR/USD makes a lower low while GBP/USD holds above its previous low, that’s a potential bullish SMT divergence, signaling weakening selling pressure and possible reversal.
This method is rooted in price action and liquidity concepts often used by traders following ICT (Inner Circle Trader) principles. SMT divergence aims to expose smart money manipulation or reaccumulation/distribution before retail traders catch on.
Unlike RSI or MACD divergence, SMT divergence uses price comparisons between instruments, not indicators.
How Many Types of Divergence Are There?
In price action trading, there are three key divergence types:
- Classic Divergence – Occurs when price makes a higher high or lower low, but an indicator like RSI or MACD shows the opposite.
- Hidden Divergence – Happens when price makes a higher low (in an uptrend) or lower high (in a downtrend), but the indicator does the opposite.
- SMT Divergence – Compares price behavior between two correlated instruments (e.g., EUR/USD and GBP/USD). A mismatch in structure (e.g., one makes a new low, the other doesn’t) may reveal institutional activity.
Only SMT divergence shows inter-market discrepancies, making it a leading signal for potential reversals.

SMT Divergence Charts: How to Spot Real Setups
SMT divergence setups become clear when you compare swing points across related assets. Here’s how:
Example:
- GBP/USD makes a lower low.
- EUR/USD forms a higher low (fails to make a new low).
- This mismatch reveals bullish SMT divergence.
How to confirm:
- Wait for Break of Structure (BOS) or Order Block near the divergence.
- Check if divergence happens near liquidity zones or support/resistance.

Bullish vs Bearish SMT Divergence: What’s the Difference?
SMT divergence lets traders see the cracks in market strength or weakness before retail traders react.
| Type | Signal | Meaning | Confirmation Tools |
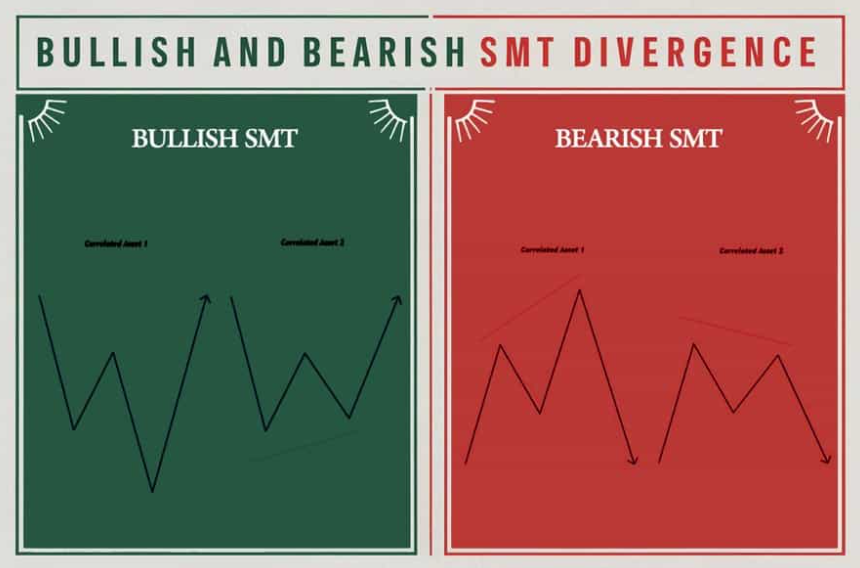
| Bullish SMT | One asset forms a lower low, the other doesn’t | Price likely to reverse up | BOS, Order Block, Liquidity |
| Bearish SMT | One makes a higher high, the other lags | Price likely to reverse down | Liquidity sweep, Shift in structure |
Bullish SMT Divergence occurs when one correlated asset makes a lower low, but the other fails to do so. This suggests weakness in the selling pressure, indicating a potential price reversal to the upside.
Bearish SMT Divergence happens when one correlated asset makes a higher high, but the other does not. This signals fading buying strength, pointing to a possible downward reversal.
In both cases, SMT divergence reveals where smart money may be accumulating or distributing positions, giving traders a strategic edge in anticipating shifts before retail traders react.
Best Pairs to Trade SMT Divergence
Only use highly correlated pairs or indices where institutional flows overlap. Examples include:
- EUR/USD ↔ GBP/USD
- NASDAQ ↔ S&P 500
- AUD/USD ↔ NZD/USD
- BTC ↔ ETH
- US30 ↔ US100
- USD/JPY ↔ USD/CHF
Avoid using unrelated instruments. SMT divergence only works when comparing markets with similar drivers (e.g., USD exposure, tech sectors, commodities).
Indicators That Support SMT Divergence
While SMT Divergence is fundamentally a price-action strategy that compares two correlated instruments, some traders use supporting indicators to validate their setups, improve confidence, and filter out false signals. Below are the most commonly used tools that can complement SMT Divergence, not replace it:
Volume Profile
- Shows where high trading volume occurs at specific price levels.
- Helps identify institutional interest zones (accumulation/distribution areas).
- When SMT divergence appears near a high-volume node, it adds confluence for potential reversal.
Liquidity Sweep Indicators
- These highlight areas where stop-loss clusters may be hunted by institutions.
- Tools like “buy/sell side liquidity” overlays on platforms help visualize where liquidity has been grabbed.
- If SMT divergence forms after a liquidity sweep, it often precedes a market structure shift.
Market Structure Tools
- Indicators that automatically plot Break of Structure (BOS) or Change of Character (CHOCH) can help you confirm that SMT divergence aligns with a broader trend reversal.
- These tools reinforce the validity of divergence when followed by structural breaks.
Correlation Coefficient Indicator
- Measures how strongly two instruments move in sync.
- A high correlation (above +0.80 or below –0.80) validates that the two assets are suitable for SMT comparison.
- Ensures the divergence isn’t occurring between unrelated markets.
SMT Divergence is not detected with indicators like RSI or MACD alone. These tools should be seen as secondary validation, not the source of the divergence.
Highest Time Frame to Trade SMT Divergences
The highest time frame to trade SMT divergences is the daily (D1) or 4-hour (H4) chart, as these provide cleaner, more reliable signals aligned with institutional order flow and reduce market noise.
SMT divergence is flexible and can be used across timeframes depending on your trading style:
- Swing Traders: Use H4 or Daily for cleaner setups and institutional context.
- Day Traders: Focus on M15 to H1, aligning with higher-timeframe bias.
- Scalpers: Can use M1 to M5, but must confirm with higher timeframes to avoid false signals.
Why Professional Traders Use SMT Divergence
Experienced traders and institutions use SMT divergence because it:
- Reveals early signs of reversals.
- Highlights institutional manipulation via inter-market inefficiency.
- Adds confluence to other strategies like liquidity theory and order blocks.
When used correctly, SMT divergence offers a precision entry technique with context, giving traders a real edge in volatile or manipulated markets.
Conclusion
SMT Divergence in Trading is a high-level strategy that offers clear insight into institutional moves across correlated assets. By analyzing mismatches in price structure rather than relying on lagging indicators you can anticipate market turning points with confidence.
At Ultima Markets, we equip traders with institutional-grade tools and education. Add SMT divergence to your trading arsenal and stay ahead of the crowd with smart money insights.
Disclaimer: This content is provided for informational purposes only and does not constitute, and should not be construed as, financial, investment, or other professional advice. No statement or opinion contained here in should be considered a recommendation by Ultima Markets or the author regarding any specific investment product, strategy, or transaction. Readers are advised not to rely solely on this material when making investment decisions and should seek independent advice where appropriate.


