
Ultima Markets App
Trade Anytime, Anywhere
Important Information
This website is managed by Ultima Markets’ international entities, and it’s important to emphasise that they are not subject to regulation by the FCA in the UK. Therefore, you must understand that you will not have the FCA’s protection when investing through this website – for example:
- You will not be guaranteed Negative Balance Protection
- You will not be protected by FCA’s leverage restrictions
- You will not have the right to settle disputes via the Financial Ombudsman Service (FOS)
- You will not be protected by Financial Services Compensation Scheme (FSCS)
- Any monies deposited will not be afforded the protection required under the FCA Client Assets Sourcebook. The level of protection for your funds will be determined by the regulations of the relevant local regulator.
Note: Ultima Markets is currently developing a dedicated website for UK clients and expects to onboard UK clients under FCA regulations in 2026.
If you would like to proceed and visit this website, you acknowledge and confirm the following:
- 1.The website is owned by Ultima Markets’ international entities and not by Ultima Markets UK Ltd, which is regulated by the FCA.
- 2.Ultima Markets Limited, or any of the Ultima Markets international entities, are neither based in the UK nor licensed by the FCA.
- 3.You are accessing the website at your own initiative and have not been solicited by Ultima Markets Limited in any way.
- 4.Investing through this website does not grant you the protections provided by the FCA.
- 5.Should you choose to invest through this website or with any of the international Ultima Markets entities, you will be subject to the rules and regulations of the relevant international regulatory authorities, not the FCA.
Ultima Markets wants to make it clear that we are duly licensed and authorised to offer the services and financial derivative products listed on our website. Individuals accessing this website and registering a trading account do so entirely of their own volition and without prior solicitation.
By confirming your decision to proceed with entering the website, you hereby affirm that this decision was solely initiated by you, and no solicitation has been made by any Ultima Markets entity.
I confirm my intention to proceed and enter this website Please direct me to the website operated by Ultima Markets , regulated by the FCA in the United Kingdom

In the volatile international financial market, “10-year silver trend chart” has become a popular keyword among investors, as it not only provides historical context but also helps identify trend reversals.
We will start by analyzing the highs and lows of silver prices over the past decade, exploring influencing factors to help you trade with ease and grasp the dynamics of the gold and silver markets.

10-Year Silver Trend Chart Overview
Reviewing silver price movements over the past decade, the overall trend shows significant fluctuations but a return to an upward trajectory.
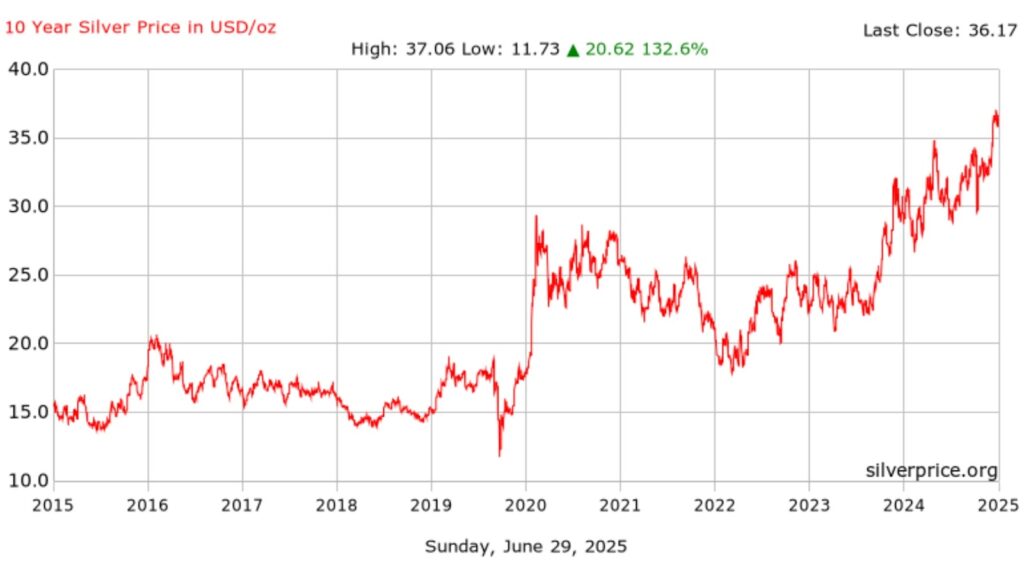
2015-2019: Silver Price Slump and Consolidation Phase
Starting in 2015, silver prices fell into a slump, with the average price at only $15.66 per ounce and a low of $13.70, marking an annual decline of 13.59%. However, prices gradually recovered from 2016, reaching a high of $20.70 that year and consolidating within the $15–$17 range until 2019.
2020 Pandemic Triggered a Rally: Silver Surged Over 47%
The 2020 pandemic sparked global monetary easing and a surge of safe-haven inflows, driving silver prices sharply higher. The year’s peak hit $29.26, with an annual increase of 47.44%, making it the most volatile year in the past decade. In 2021, silver remained in a high price range, with a peak of $29.42, supported by both safe-haven demand and industrial use.
2021-2023: Pullback and Solid Support After High-Level Volatility
However, between 2022 and 2023, the market underwent a correction, with silver prices consolidating after a pullback. The average price in 2023 fell back to $23.40, nearly flat for the year (-0.72%), but the lowest price still held above $20, indicating gradually strengthening market support.
2024-2025: Silver Hits a Decade High, Bullish Trend Continues
In 2024, silver resumed its bullish run, reaching a yearly high of $34.85 with an annual gain exceeding 20%. As of June 18, 2025, during the Asian session, spot silver was consolidating in short-term fluctuations, currently quoted at $37.06 per ounce, down slightly by 0.13% from the opening price, with an intraday high of $37.19. This indicates the bullish structure remains intact, staying near the top of the decade-long range.
Long-Term Trend Summary
Overall, silver has experienced bottom consolidation and a bullish breakout over the past decade, with its price range rising from $13.70 in 2015 to $37.19 in 2025. This trend not only reflects changes in the global economy and inflationary environment but also highlights silver’s value as both an investment and an industrial asset.
Why Analyze 10-Year Silver Price Highs and Lows?
Understanding silver’s highs and lows over the past decade helps identify market cycles, recognize long-term trends, and pinpoint key support and resistance zones. This assists investors in formulating more solid entry and exit strategies, improving trading decision quality.
- Low Points Insight: Multiple drops below $14 without breaking formed buying support.
- High Points Signal: Several rallies to $36–$37 followed by pullbacks indicate a clear resistance zone.
2025 Silver Price Latest Trend
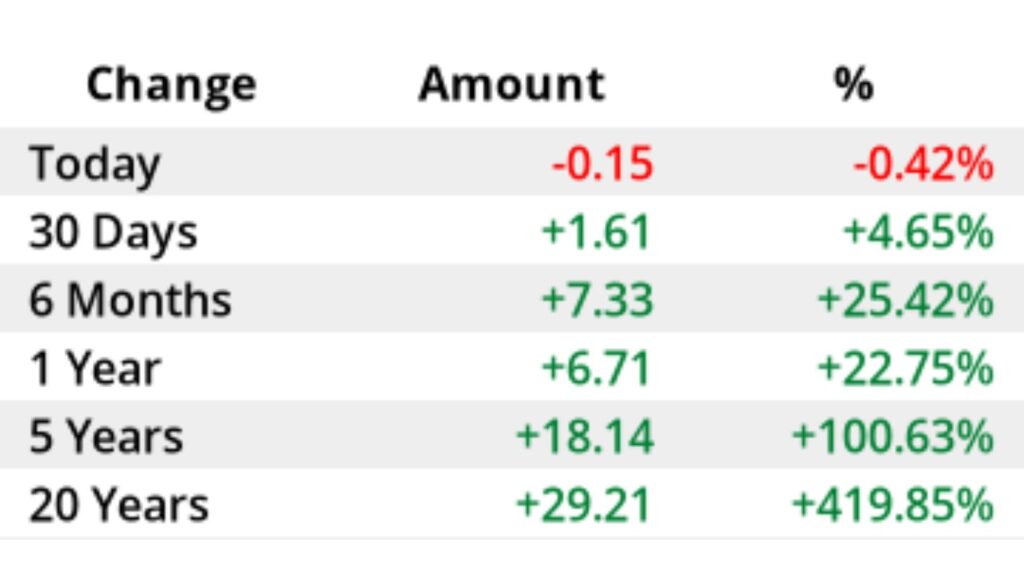
Recently, silver prices have risen from around $28.9 at the beginning of 2025 to $36.4. As of June 29, it closed at $35.82, up more than 8.6% for the month and 21.6% year-to-date. Silver futures data also show that in mid-June 2025, the highest price reached $37.33, while the lowest was $36.17, indicating relatively volatile movement within the range.
Notably, demand recovery in Asian markets such as China and India, along with increasing industrial use in new energy and solar markets, has strengthened silver’s role beyond a safe-haven asset, providing it with solid physical demand support.
What Does Breaking a 13-Year High in 2025 Mean?
Since June 2025, silver has surged over 11%, breaking past the 2012 high and reaching its highest level since then. This rally, driven mainly by recovering industrial demand, highlights the policy significance and strategic value of the 10-year silver trend chart data.
Key Factors Influencing Silver Prices
A deep analysis of the 10-year silver trend chart requires examining the following core variables:
US Dollar Trend and Interest Rate Policy
Silver is priced in US dollars, and the dollar’s strength directly affects its price performance. When the dollar strengthens, silver typically faces downward pressure; conversely, when the dollar weakens, especially when the Federal Reserve cuts rates or maintains a low-interest policy, silver tends to be favored due to lower holding costs, pushing prices higher.
Inflation Pressure and Safe-Haven Demand
Silver has inflation-hedging properties and is often regarded as an anti-inflation asset when prices rise and purchasing power declines. When market uncertainty over the economic outlook increases, safe-haven sentiment intensifies, driving up silver demand and pushing prices higher.
Industrial Use and Physical Demand
Silver is widely used in industries such as electronics, solar energy, and healthcare, making it an essential raw material for industrial production. When the global economy recovers and manufacturing expands, the physical demand for silver increases, supporting its steady price growth and reflecting a supply-demand-driven characteristic.
Geopolitics and Market Sentiment
Geopolitical risks, such as wars or political instability, often trigger safe-haven capital inflows into the precious metals market, benefiting silver as well. In addition, shifts in risk appetite within financial markets or unexpected events can also drive significant short-term volatility in silver prices.
Silver vs Gold: Which Is Better for Medium- to Long-Term Allocation?
Silver and gold are both precious metal safe-haven assets, but their attributes differ slightly. Gold prices are relatively stable, making it suitable for long-term value storage, while silver, with both industrial demand and investment attributes, is more volatile and offers greater upside potential.
From a medium- to long-term allocation perspective, silver is often regarded as a “high-leverage version of gold,” making it more suitable for aggressive investors to position during periods of inflation expectations and industrial cycle upswings, enhancing overall portfolio growth and flexibility.
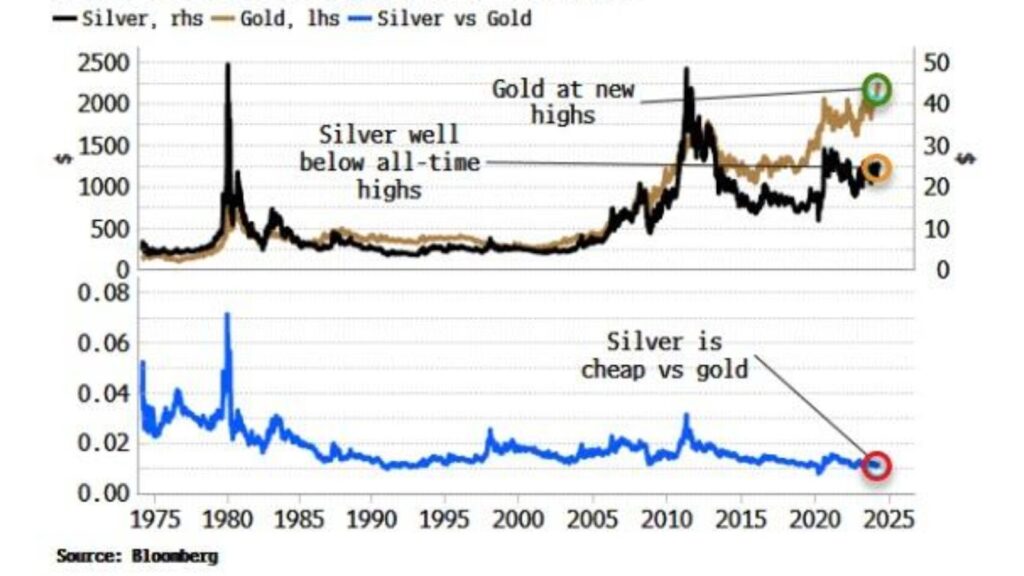
By Comparing Silver and Gold Price Trends:
- Silver shows higher volatility, with price swings often exceeding gold, but enjoys stronger support from industrial demand.
- Gold, on the other hand, has a more pronounced safe-haven attribute, though its price performance is often boosted by silver’s catch-up rallies.
For those looking to capture both value storage and physical demand momentum, consider opening an MT4/MT5 account with Ultima Markets to simultaneously position in XAUUSD and XAGUSD, using leverage strategies for trading.
How to Invest in Silver Through Ultima Markets?
When registering and trading on the platform, note the following advantages:
Trade Silver Contracts for Difference (CFDs)
Ultima Markets offers silver CFD products, allowing investors to trade based on price fluctuations without holding physical silver. This enables flexible two-way trading to capture market opportunities.
Leverage Up to 1:2000 to Maximize Returns
The platform offers leverage up to 1:2000, suitable for short-term trading and flexible capital utilization, effectively improving capital efficiency. It is recommended for investors with strong risk management capabilities.
Trade via MT4/MT5 or UM App
Users can trade silver through MT4, MT5, or the Ultima Markets App, which support various chart analysis tools and EA automated trading strategies to enhance trading efficiency.
Provide a Demo Account for Practice
Beginners can first register a demo account to practice silver trading, experience market fluctuations and order execution without using real funds, helping to build strategies and trading confidence.
Master Market Tools and Analysis Resources
The platform integrates professional analysis tools such as Trading Central and real-time market information to help users assess silver price trends and make more informed trading decisions.
Silver Outlook for the Next 10 Years (2025–2035)
Over the next decade (2025–2035), silver will continue to be driven by both industrial and investment demand. With the rapid growth of green technologies such as electric vehicles and solar photovoltaics, silver’s industrial use is expected to grow steadily. At the same time, global economic uncertainty and inflationary pressures will enhance silver’s appeal as a precious metal safe-haven asset.
Based on current market trends and supply-demand analysis, the following factors should be monitored:
- Growth in new energy and industrial applications, especially solar energy and 5G equipment.
- Ongoing inflation and central bank policies, with inflation expectations continuing to support silver.
- Technical analysis indicates that if silver prices keep hitting new highs, it will attract more capital inflows.
Overall, institutions generally expect silver to remain within the $36–38 range, but if this range is broken, the next high could potentially reach $40 to $45.
Silver Investment Beginner FAQ
Q1: What costs are involved in silver CFD trading?
A: The main costs include spreads and commissions. For example, at Ultima Markets, ECN accounts offer spreads as low as 0.0 and commissions of only $5 per lot, which is among the lowest in the industry.
Q2: Is silver trading better for long-term or short-term strategies?
A: Silver is highly volatile, making it more suitable for short- to medium-term swing trading. Combining leverage with technical analysis tools can improve capital efficiency.
Conclusion
Looking back over the past decade, the 10-year silver trend chart is not just an informational graph but also a crucial reference for predicting future movements. If you wish to turn these insights into actual investment results, Ultima Markets offers a comprehensive trading environment: from demo accounts to leverage strategy tools, helping you position, execute, and manage risks in the XAGUSD market.
Disclaimer: This content is provided for informational purposes only and does not constitute, and should not be construed as, financial, investment, or other professional advice. No statement or opinion contained here in should be considered a recommendation by Ultima Markets or the author regarding any specific investment product, strategy, or transaction. Readers are advised not to rely solely on this material when making investment decisions and should seek independent advice where appropriate.
Latest Articles

FOLLOW US


Ultima Markets is a member of The Financial Commission, an international independent body responsible for resolving disputes in the Forex and CFD markets.
All clients of Ultima Markets are protected under insurance coverage provided by Willis Towers Watson (WTW), a global insurance brokerage established in 1828, with claims eligibility up to US$1,000,000 per account.
Ultima Markets is the first United CFD broker to be part of the United Nations Global Compact.
FOLLOW US
TRADE WITH US
RISK DISCLOSURE
Risk Warning:
Trading leveraged financial products, including Contracts for Difference (CFDs), carries a high level of risk and may result in losses exceeding your initial investment. These products are not suitable for all investors and should only be traded with funds you can afford to lose. You do not own or have any rights to the underlying assets of these derivatives (e.g., entitlement to dividends). Please ensure you fully understand the associated risks. Before trading, consider your level of experience, investment objectives, and seek independent financial advice if necessary. Refer to our legal documents and disclosures before making any trading decisions.
General Advice Warning:
The information provided on this website is general in nature and does not take into account your personal objectives, financial situation, or needs. Before acting on any advice, you should assess its appropriateness in light of your individual circumstances and consult our legal documentation.
Regional Restrictions:
The information and services on this website are not intended for residents of certain jurisdictions, including but not limited to the United States, United Kingdom, Singapore, and any jurisdictions subject to international sanctions. For further information, please contact our customer support team.
Regulatory Information:
Ultima Markets is a trading name shared amongst multiple entities operating in various jurisdictions. These following entities are authorised to operate under the Ultima Markets brand and trademarks.
-
Ultima Markets UK Limited, reference number 470325, is authorised and regulated by the Financial Conduct Authority (FCA). Registered address: 1 Blossom Yard, Fourth Floor, London, E1 6RS, UNITED KINGDOM.
-
Ultima Markets Ltd is authorised and regulated by the Financial Services Commission (FSC) of Mauritius as a Full-Service Investment Dealer (excluding Underwriting), under licence number GB 23201593.
Registered address: 2nd Floor, The Catalyst, 40 Silicon Avenue, Ebene Cybercity, 72201, Mauritius.
Copyright © 2026 Ultima Markets Ltd. All rights reserved.
-

Messenger


Continue on Messenger
Take the conversation to your Messenger account. You can return anytime.
Scan the QR code and then send the message that appears in your Messenger.
Open Messenger on this device.
-

Instagram

Continue on Instagram
Take the conversation to your Instagram account. You can return anytime.
Scan the QR code to open Instagram. Follow @ultima_markets to send a DM.
Open Instagram on this device.
-

Live Chat
-
