Important Information
This website is managed by Ultima Markets’ international entities, and it’s important to emphasise that they are not subject to regulation by the FCA in the UK. Therefore, you must understand that you will not have the FCA’s protection when investing through this website – for example:
- You will not be guaranteed Negative Balance Protection
- You will not be protected by FCA’s leverage restrictions
- You will not have the right to settle disputes via the Financial Ombudsman Service (FOS)
- You will not be protected by Financial Services Compensation Scheme (FSCS)
- Any monies deposited will not be afforded the protection required under the FCA Client Assets Sourcebook. The level of protection for your funds will be determined by the regulations of the relevant local regulator.
Note: UK clients are kindly invited to visit https://www.ultima-markets.co.uk/. Ultima Markets UK expects to begin onboarding UK clients in accordance with FCA regulatory requirements in 2026.
If you would like to proceed and visit this website, you acknowledge and confirm the following:
- 1.The website is owned by Ultima Markets’ international entities and not by Ultima Markets UK Ltd, which is regulated by the FCA.
- 2.Ultima Markets Limited, or any of the Ultima Markets international entities, are neither based in the UK nor licensed by the FCA.
- 3.You are accessing the website at your own initiative and have not been solicited by Ultima Markets Limited in any way.
- 4.Investing through this website does not grant you the protections provided by the FCA.
- 5.Should you choose to invest through this website or with any of the international Ultima Markets entities, you will be subject to the rules and regulations of the relevant international regulatory authorities, not the FCA.
Ultima Markets wants to make it clear that we are duly licensed and authorised to offer the services and financial derivative products listed on our website. Individuals accessing this website and registering a trading account do so entirely of their own volition and without prior solicitation.
By confirming your decision to proceed with entering the website, you hereby affirm that this decision was solely initiated by you, and no solicitation has been made by any Ultima Markets entity.
I confirm my intention to proceed and enter this website Please direct me to the website operated by Ultima Markets , regulated by the FCA in the United Kingdom
Ultima Markets App
Trade Anytime, Anywhere


The RSI indicator (Relative Strength Index) is one of the most widely used tools in technical analysis. Designed to measure the speed and strength of price movements, it helps traders spot potential turning points in the market. Whether you are new to trading or an experienced investor, understanding what is RSI indicator, how to use RSI indicator, and how to read RSI indicator can make a significant difference in timing entries and exits.
Key takeaways
- The RSI indicator is a momentum oscillator from 0 to 100 created by J Welles Wilder Jr in 1978, with 14 periods as the common default.
- Traders most often use 70 as overbought and 30 as oversold, and 50 as a momentum midline, with threshold tweaks for strong trends
- Signals include overbought or oversold reversals, divergences, failure swings, and centreline crossovers, best confirmed with price action and trend filters.
- RSI can lag and stay extreme in persistent trends, so adapt settings and combine with other tools.
What is RSI Indicator
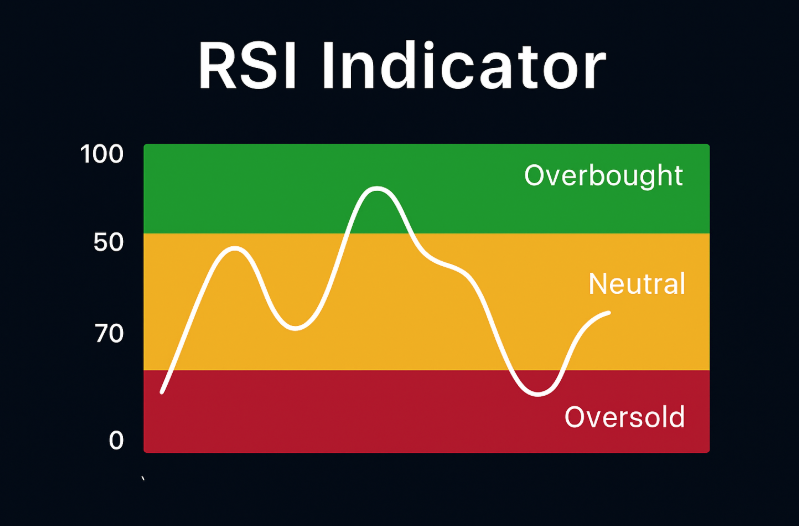
The Relative Strength Index RSI is a momentum oscillator that measures the speed and magnitude of recent price changes on a 0 to 100 scale. It was introduced by J Welles Wilder Jr in 1978 and is most commonly set to 14 periods.
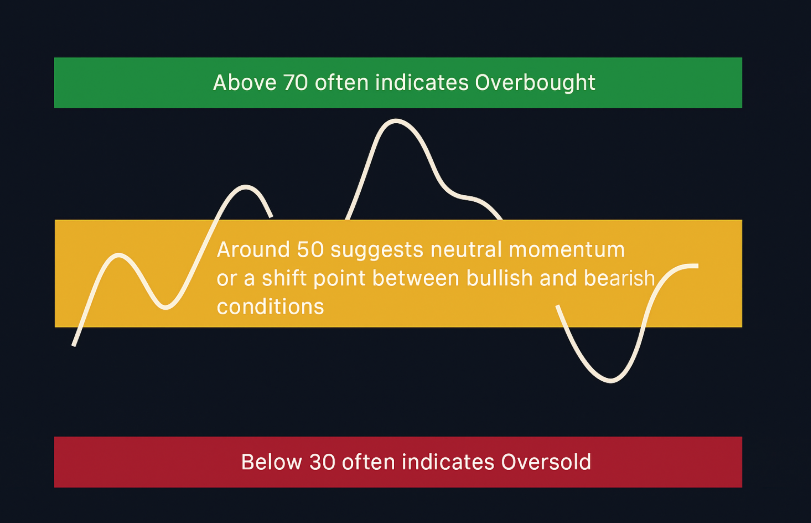
Standard zones
- Above 70 often indicates overbought
- Below 30 often indicates oversold
- Around 50 suggests neutral momentum or a shift point between bullish and bearish conditions.
How to Read RSI Indicator
The Relative Strength Index (RSI) is not just about watching whether it’s above 70 or below 30. To read it effectively, you need to look at levels, slopes, patterns, and how it behaves relative to price. Here are the key steps:
Understand the Zones
- Above 70: Overbought: Price may be stretched to the upside. Instead of selling immediately, treat this as a caution flag. The market could stay overbought if the trend is strong.
- Below 30: Oversold: Price may be stretched to the downside. Again, don’t buy blindly, look for confirmation such as bullish candlesticks or support levels.
- Around 50: Momentum midpoint: Crossing above 50 often confirms bullish momentum, while dropping below 50 signals bearish momentum.
Strong uptrends often keep RSI between 40–80, while strong downtrends stay between 20–60. Recognising this “range shift” helps you avoid false reversal calls.
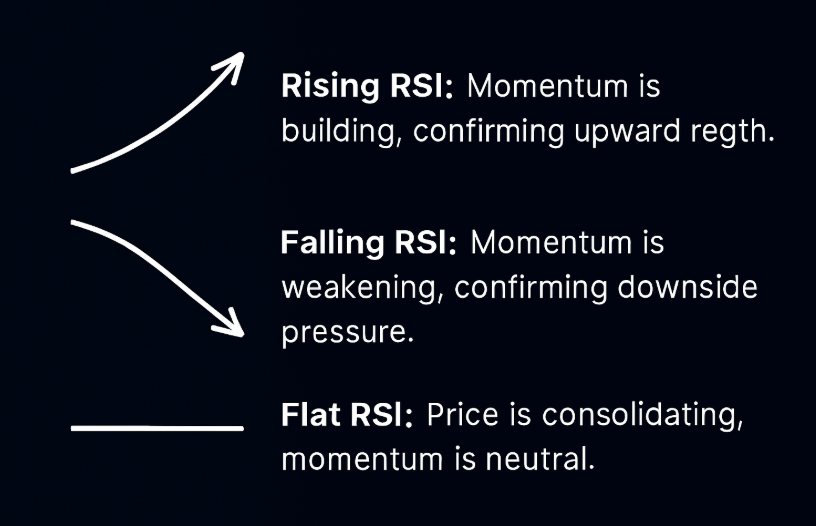
Watch the Direction (Slope)
The slope of RSI shows acceleration or deceleration in momentum:
- Rising RSI: Momentum is building, confirming upward strength.
- Falling RSI: Momentum is weakening, confirming downside pressure.
- Flat RSI: Price is consolidating, momentum is neutral.
This adds more context than just a single RSI number.
Look for Divergences
A divergence happens when RSI moves in the opposite direction of price:
- Bullish divergence: Price makes lower lows, but RSI makes higher lows, potential sign of an upcoming rally.
- Bearish divergence: Price makes higher highs, but RSI makes lower highs, potential sign of weakening bullish momentum.
Divergences are stronger when they appear near support or resistance levels.
Spot Failure Swings
This is one of Wilder’s original signals:
- Bearish failure swing: RSI goes above 70, pulls back, rises again but fails to make a new high, then breaks its prior low, strong sell signal.
- Bullish failure swing: RSI goes below 30, rebounds, dips again but holds above the previous low, then breaks higher, strong buy signal.
Failure swings give clearer entry signals than simply overbought/oversold conditions.
Combine with Price Action
Reading RSI in isolation can mislead. Pair it with:
- Trendlines: A bullish divergence is stronger if price is also near long-term support.
- Moving Averages: RSI crossing above 50 while price is above a 50-day MA adds conviction.
- Candlestick patterns: Engulfing candles or dojis near RSI extremes confirm reversals.
How to Use RSI Indicator
Core setups you can test
- Overbought to normalisation Wait for RSI to rise above 70 then fall back below 70 to time partial exits or mean-reversion shorts in ranges.
- Oversold to recovery Wait for RSI below 30 then a move back above 30 to time entries in ranges.
- Divergence confirmation Combine RSI divergence with a break of market structure for higher quality signals.
- Trend filter plus RSI In strong trends raise or lower your thresholds for example 80 and 20, use 50-line cross as confirmation, and trade pullbacks with the trend.
Timeframe and settings
- Shorter lookbacks 7 to 9 give faster signals and more whipsaws
- Default 14 balances responsiveness and noise
- Longer 20 to 25 smooth signals for swing trades.
These are widely taught practices, match the setting to volatility and your holding period, and validate in your market with testing.
RSI Formula and Example
The Relative Strength Index (RSI) is calculated in two steps:
Step 1: Calculate Relative Strength (RS)
RS = (Average Gain over N periods) ÷ (Average Loss over N periods)
- Average Gain = total of all gains over N periods ÷ N
- Average Loss = total of all losses over N periods ÷ N
Wilder recommended 14 periods as the default.
Step 2: Convert RS to RSI
RSI = 100 − [100 ÷ (1 + RS)]
This transforms RS into a value between 0 and 100.
For Example
Imagine a stock has the following results over 14 days:
- Total gains = 70 points
- Total losses = 30 points
- Average Gain = 70 ÷ 14 = 5
- Average Loss = 30 ÷ 14 ≈ 2.14
- RS = 5 ÷ 2.14 ≈ 2.34
- RSI = 100 − [100 ÷ (1 + 2.34)] = 100 − [100 ÷ 3.34] = 100 − 29.94 = 70.06
Result: RSI ≈ 70, which suggests the asset is right at the overbought threshold.
Wilder’s Smoothing Method
For periods after the first calculation:
- New Average Gain = [(Previous Average Gain × 13) + Current Gain] ÷ 14
- New Average Loss = [(Previous Average Loss × 13) + Current Loss] ÷ 14
This smoothing method reduces noise and makes RSI more reliable than simple averages.
Is RSI A Good Indicator
Yes, the RSI is a good indicator when used correctly. It is simple, widely available, and effective for measuring momentum, spotting overbought or oversold conditions, and identifying divergences. However, RSI is not foolproof. In strong trends it can stay extreme for long periods and give false signals, so traders should adapt thresholds (for example 80/20 instead of 70/30) and confirm signals with price action, trend analysis, or other indicators.
Common Mistakes to Avoid
The biggest mistakes traders make with the RSI are using 70/30 levels mechanically in strong trends, ignoring market regime (range vs. trend), acting without confirmation from price action, and relying on RSI alone. Always adapt thresholds, combine with trend filters, and seek confirmation to reduce false signals.
Conclusion
The RSI indicator remains one of the most reliable tools for traders to gauge momentum, spot divergences, and anticipate potential reversals. While it is simple to understand, its real power comes from applying it in context, adapting thresholds in strong trends, combining it with other indicators, and confirming with price action. Used wisely, RSI can help traders sharpen entries, exits, and overall risk management.
At Ultima Markets, we believe that knowledge is the strongest edge in trading. That’s why our platform combines advanced charting tools, educational resources, and a secure trading environment to help you put strategies like RSI into practice with confidence.
Disclaimer: This content is provided for informational purposes only and does not constitute, and should not be construed as, financial, investment, or other professional advice. No statement or opinion contained here in should be considered a recommendation by Ultima Markets or the author regarding any specific investment product, strategy, or transaction. Readers are advised not to rely solely on this material when making investment decisions and should seek independent advice where appropriate.
Latest Articles


FOLLOW US


Ultima Markets is a member of The Financial Commission, an international independent body responsible for resolving disputes in the Forex and CFD markets.
All clients of Ultima Markets are protected under insurance coverage provided by Willis Towers Watson (WTW), a global insurance brokerage established in 1828, with claims eligibility up to US$1,000,000 per account.
Ultima Markets is the first United CFD broker to be part of the United Nations Global Compact.
FOLLOW US
TRADE WITH US
RISK DISCLOSURE
Risk Warning:
Trading leveraged financial products, including Contracts for Difference (CFDs), carries a high level of risk and may result in losses exceeding your initial investment. These products are not suitable for all investors and should only be traded with funds you can afford to lose. You do not own or have any rights to the underlying assets of these derivatives (e.g., entitlement to dividends). Please ensure you fully understand the associated risks. Before trading, consider your level of experience, investment objectives, and seek independent financial advice if necessary. Refer to our legal documents and disclosures before making any trading decisions.
General Advice Warning:
The information provided on this website is general in nature and does not take into account your personal objectives, financial situation, or needs. Before acting on any advice, you should assess its appropriateness in light of your individual circumstances and consult our legal documentation.
Regional Restrictions:
The information and services on this website are not intended for residents of certain jurisdictions, including but not limited to the United States, United Kingdom, Singapore, and any jurisdictions subject to international sanctions. For further information, please contact our customer support team.
Regulatory Information:
Ultima Markets is a trading name shared amongst multiple entities operating in various jurisdictions. These following entities are authorised to operate under the Ultima Markets brand and trademarks.
-
Ultima Markets UK Limited, reference number 470325, is authorised and regulated by the Financial Conduct Authority (FCA). Registered address: 1 Blossom Yard, Fourth Floor, London, E1 6RS, UNITED KINGDOM.
-
Ultima Markets Ltd is authorised and regulated by the Financial Services Commission (FSC) of Mauritius as a Full-Service Investment Dealer (excluding Underwriting), under licence number GB 23201593.
Registered address: 2nd Floor, The Catalyst, 40 Silicon Avenue, Ebene Cybercity, 72201, Mauritius.
-
Ultima Markets EU OÜ, incorporated in Estonia with registry code 17134727. Registered address: Harju maakond, Tallinn, Kristiine linnaosa, Seebi tn 1-1501, 11316. This entity does not offer regulated financial products or provide trading services.
Copyright © 2026 Ultima Markets Ltd. All rights reserved.
-

Messenger


Continue on Messenger
Take the conversation to your Messenger account. You can return anytime.
Scan the QR code and then send the message that appears in your Messenger.
Open Messenger on this device.
-

Instagram

Continue on Instagram
Take the conversation to your Instagram account. You can return anytime.
Scan the QR code to open Instagram. Follow @ultima_markets to send a DM.
Open Instagram on this device.
-

Live Chat
-
