Ultima Markets App
Trade Anytime, Anywhere
Important Information
This website is managed by Ultima Markets’ international entities, and it’s important to emphasise that they are not subject to regulation by the FCA in the UK. Therefore, you must understand that you will not have the FCA’s protection when investing through this website – for example:
- You will not be guaranteed Negative Balance Protection
- You will not be protected by FCA’s leverage restrictions
- You will not have the right to settle disputes via the Financial Ombudsman Service (FOS)
- You will not be protected by Financial Services Compensation Scheme (FSCS)
- Any monies deposited will not be afforded the protection required under the FCA Client Assets Sourcebook. The level of protection for your funds will be determined by the regulations of the relevant local regulator.
Note: Ultima Markets is currently developing a dedicated website for UK clients and expects to onboard UK clients under FCA regulations in 2026.
If you would like to proceed and visit this website, you acknowledge and confirm the following:
- 1.The website is owned by Ultima Markets’ international entities and not by Ultima Markets UK Ltd, which is regulated by the FCA.
- 2.Ultima Markets Limited, or any of the Ultima Markets international entities, are neither based in the UK nor licensed by the FCA.
- 3.You are accessing the website at your own initiative and have not been solicited by Ultima Markets Limited in any way.
- 4.Investing through this website does not grant you the protections provided by the FCA.
- 5.Should you choose to invest through this website or with any of the international Ultima Markets entities, you will be subject to the rules and regulations of the relevant international regulatory authorities, not the FCA.
Ultima Markets wants to make it clear that we are duly licensed and authorised to offer the services and financial derivative products listed on our website. Individuals accessing this website and registering a trading account do so entirely of their own volition and without prior solicitation.
By confirming your decision to proceed with entering the website, you hereby affirm that this decision was solely initiated by you, and no solicitation has been made by any Ultima Markets entity.
I confirm my intention to proceed and enter this website Please direct me to the website operated by Ultima Markets , regulated by the FCA in the United KingdomRed Hammer Candlestick: Spot Reversals
What Is a Red Hammer Candlestick?
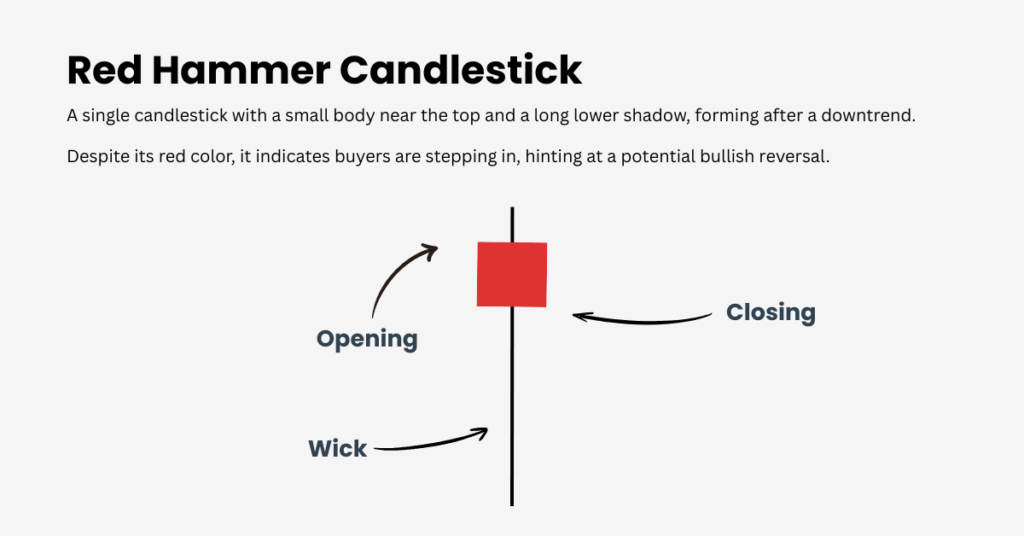
The red hammer candlestick is a classic pattern that can signal a potential change in market sentiment. Unlike the green hammer, which closes higher than it opens, the red hammer closes lower than its opening price.
Despite its red color, it indicates that buyers are starting to step in after a period of selling pressure, hinting at a potential bullish reversal. This makes the red hammer a valuable tool for traders looking to anticipate trend changes in stocks, forex, or commodities.
Why Beginners Should Care About the Red Hammer
For novice traders, the red hammer offers a clear visual cue of shifting momentum. Initially, sellers dominate, pushing prices lower. However, buyers eventually step in, rejecting lower prices, which creates the long lower shadow that defines the hammer.

Even though the candle closes lower than it opens, the long lower shadow shows that buyers stepped in strongly to push the price back up from the lows, reflecting early bullish intent despite the red color. Understanding this can help beginners spot potential reversals without relying on complex indicators, making it a simple yet powerful addition to your trading toolkit.
How to Recognise a Red Hammer Candlestick: Step by Step
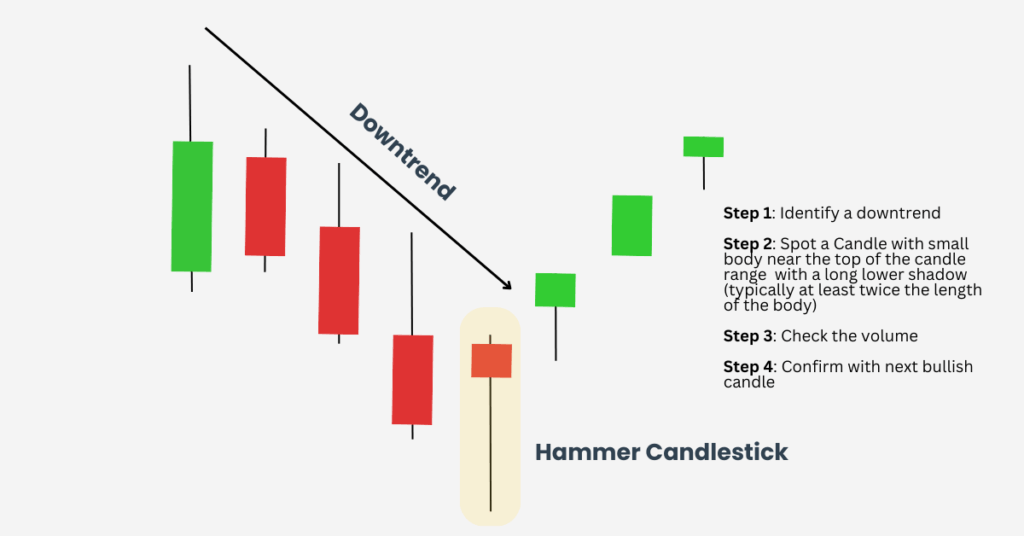
Recognising a red hammer involves understanding both the candle’s structure and the market context:

- Identify the Trend: Ensure the red hammer forms after a downtrend, which typically shows a series of lower highs and lower lows. Tools like trendlines or simple moving averages can help confirm the trend.
- Observe the Candle Shape: Look for a small body at the top and a long lower shadow. This shows that buyers entered to push the price back up.
- Check Volume: Higher trading volume strengthens the signal, confirming that buyers are actively participating.
- Confirm with the Next Candle: A bullish reversal is more reliable when the next candle closes above the hammer’s high. This price break signals a potential long entry.
- Set Your Stop-Loss: Place it just below the hammer’s low to protect against unexpected downward moves.
By paying attention to both the downtrend context and confirmation candle, beginners can improve their chances of spotting genuine reversals.
Red Hammer vs Green Hammer
While both red and green hammers are considered bullish reversal patterns, they carry slightly different implications. The green hammer, also called a bullish hammer, typically signals stronger buying momentum, while the red hammer indicates that buyers are entering gradually.
| Feature | Red Hammer | Green Hammer |
| Body Color | Red | Green |
| Market Sentiment | Mild bullish reversal | Stronger bullish reversal |
| Buying Pressure | Moderate | Moderate to High |
| Ideal Use | Beginners spotting cautious reversals | Traders seeking aggressive entry points |
The red hammer is particularly useful for beginners looking to spot cautious reversals, whereas the green hammer may appeal more to traders seeking aggressive entry points. It’s important not to confuse the red hammer with other patterns, such as the hanging man or inverted hammer, which can suggest potential bearish reversals instead.
Common Mistakes When Trading Red Hammers
Beginners often make these mistakes when trading red hammer patterns:
- Entering a trade without waiting for confirmation from the following candle.
- Failing to set a proper stop-loss, exposing themselves to unnecessary risk.
- Ignoring trading volume or the broader market context.
- Confusing the red hammer with a hanging man candlestick, which can indicate bearish reversal.
Being aware of these pitfalls helps traders use the red hammer pattern more effectively and improve their results.
After You’ve Understood What a Red Hammer Candlestick Is…
You may ask: “How do I trade it effectively?”

The key is patience and context. Look for the red hammer after a well-established downtrend, with several lower highs and lower lows. Confirm the reversal with the next bullish candle closing above the hammer’s high, ideally on higher trading volume. Combining this pattern with support levels, trendlines, and indicators like RSI or moving averages can further strengthen the signal.
If confirmation is present, consider entering a long position, placing a stop-loss just below the hammer’s low to manage risk. Patience is critical—never trade based solely on one candlestick. By combining trend analysis, confirmation signals, and risk management, traders can make informed, disciplined decisions while capitalizing on potential trend reversals.
Practical Tips for Beginners
Here are some practical tips to help you trade the red hammer candlestick effectively:
- Combine with Technical Indicators:
- RSI (Relative Strength Index): Look for the red hammer forming when RSI is below 30 (oversold territory). This strengthens the potential reversal signal.
- Moving Averages: Check if the price is near a significant moving average (e.g., 50-day or 200-day). A hammer near these levels indicates support and higher probability of a rebound.
- MACD: A bullish crossover after the hammer pattern can act as confirmation that the trend may reverse.
- Focus on Support Levels: Hammer patterns are more reliable near previous lows or key Fibonacci retracement levels (e.g., 38.2% or 61.8%). These areas often attract buyers.
- Watch Volume: A red hammer on higher-than-average trading volume indicates that buyers are actively stepping in, making the reversal more credible.
Start small by testing your strategy on a demo account first, limiting your position size to avoid significant losses while you practice identifying patterns and confirmations.
Remember patience is key. Always wait for a confirmation candle before entering a trade, ideally one that closes above the hammer’s high. Chasing the pattern without validation can lead to unnecessary risk, so letting the market confirm the signal helps you make more disciplined and informed decisions.
Conclusion
In essence, the red hammer candlestick is a single candlestick with a small body near the top and a long lower shadow at the bottom of a downtrend. It signals that buyers are beginning to act, hinting at a potential bullish reversal.
Beginners should always wait for confirmation before entering a trade and use stop-loss orders and proper position sizing to manage risk. Combining the red hammer with support and resistance levels, volume analysis, and other technical indicators can improve trading decisions and help capitalize on trend reversals.
Disclaimer: This content is provided for informational purposes only and does not constitute, and should not be construed as, financial, investment, or other professional advice. No statement or opinion contained here in should be considered a recommendation by Ultima Markets or the author regarding any specific investment product, strategy, or transaction. Readers are advised not to rely solely on this material when making investment decisions and should seek independent advice where appropriate.


