Ultima Markets App
Trade Anytime, Anywhere
Important Information
This website is managed by Ultima Markets’ international entities, and it’s important to emphasise that they are not subject to regulation by the FCA in the UK. Therefore, you must understand that you will not have the FCA’s protection when investing through this website – for example:
- You will not be guaranteed Negative Balance Protection
- You will not be protected by FCA’s leverage restrictions
- You will not have the right to settle disputes via the Financial Ombudsman Service (FOS)
- You will not be protected by Financial Services Compensation Scheme (FSCS)
- Any monies deposited will not be afforded the protection required under the FCA Client Assets Sourcebook. The level of protection for your funds will be determined by the regulations of the relevant local regulator.
Note: Ultima Markets is currently developing a dedicated website for UK clients and expects to onboard UK clients under FCA regulations in 2026.
If you would like to proceed and visit this website, you acknowledge and confirm the following:
- 1.The website is owned by Ultima Markets’ international entities and not by Ultima Markets UK Ltd, which is regulated by the FCA.
- 2.Ultima Markets Limited, or any of the Ultima Markets international entities, are neither based in the UK nor licensed by the FCA.
- 3.You are accessing the website at your own initiative and have not been solicited by Ultima Markets Limited in any way.
- 4.Investing through this website does not grant you the protections provided by the FCA.
- 5.Should you choose to invest through this website or with any of the international Ultima Markets entities, you will be subject to the rules and regulations of the relevant international regulatory authorities, not the FCA.
Ultima Markets wants to make it clear that we are duly licensed and authorised to offer the services and financial derivative products listed on our website. Individuals accessing this website and registering a trading account do so entirely of their own volition and without prior solicitation.
By confirming your decision to proceed with entering the website, you hereby affirm that this decision was solely initiated by you, and no solicitation has been made by any Ultima Markets entity.
I confirm my intention to proceed and enter this website Please direct me to the website operated by Ultima Markets , regulated by the FCA in the United KingdomWhat Is the QM Pattern in Trading?
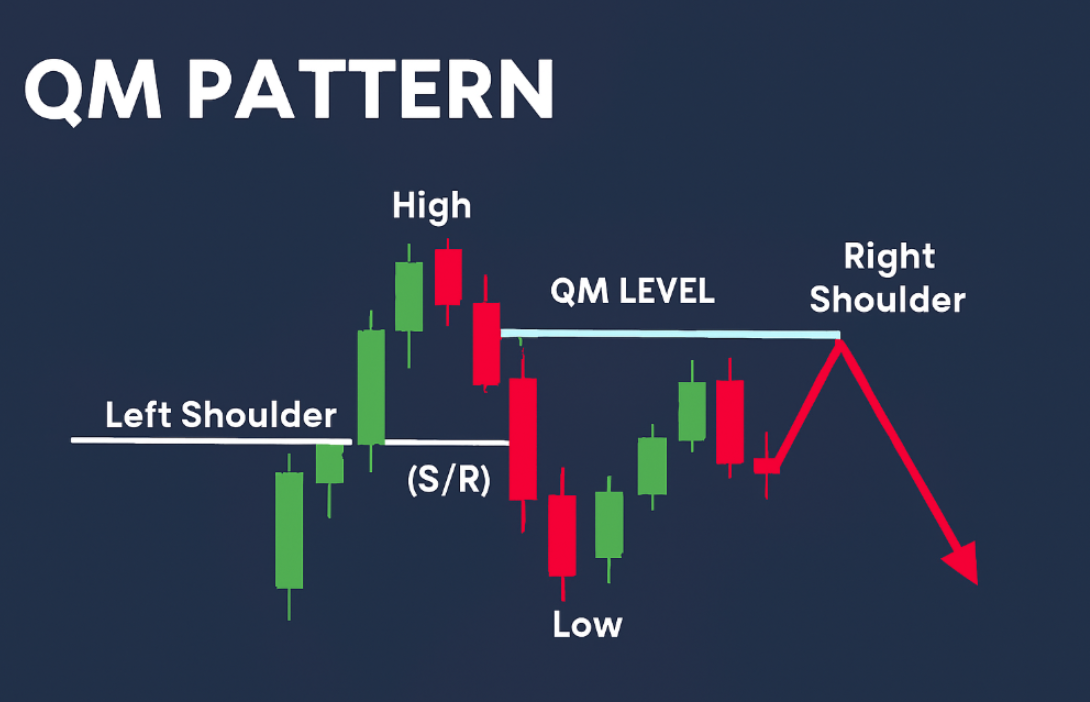
The QM pattern also called the Quasimodo pattern is a price action reversal structure that forms after a trend makes a final extension then shifts to lower lows and lower highs in an uptrend or higher highs and higher lows in a downtrend. It can appear on any market or timeframe and is used to time turns with defined invalidation.
QM structure at a glance
- Trend makes a new extreme the “head”
- Price breaks structure by printing a lower low in prior uptrends or a higher high in prior downtrends
- A pullback returns toward the last swing before the break the “left shoulder” area
- A short or long setup triggers at this return to origin with stops beyond the shoulder and targets toward the structure break and opposing liquidity.

QM Pattern vs Head And Shoulders
Both are reversal structures, but they trigger and manage risk differently. QM Pattern requires a break of market structure first, then a retest of the left shoulder zone for entry. Head And Shoulders focuses on a neckline break after forming left shoulder, head, and right shoulder.
| Feature | QM Pattern | Head And Shoulders |
| Market Logic | Structure break then return to origin | Three swing tops or bottoms with neckline |
| Geometry | Often asymmetric and “crooked” | Often more symmetric |
| Entry Cue | Retest of left shoulder supply or demand after the break | Neckline break or neckline retest |
| Invalidation | Beyond shoulder extreme | Above head for bearish or below head for bullish variants |
| Targets | First at the structure break swing then opposing liquidity | Measured move from head to neckline projected from the break |
| Best Use | Early reversal timing with clear invalidation | Classic confirmation after a full pattern forms |
Bullish QM Pattern vs Bearish QM Pattern
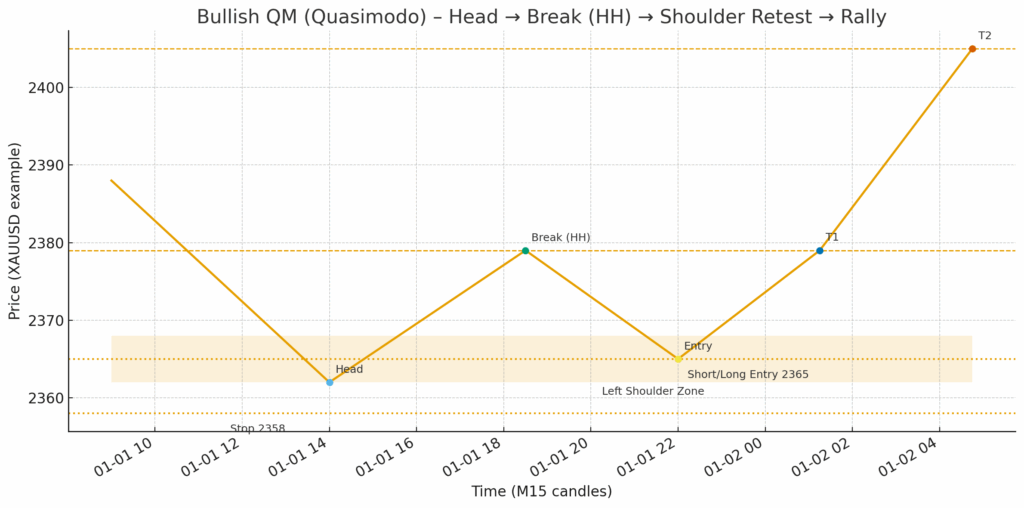
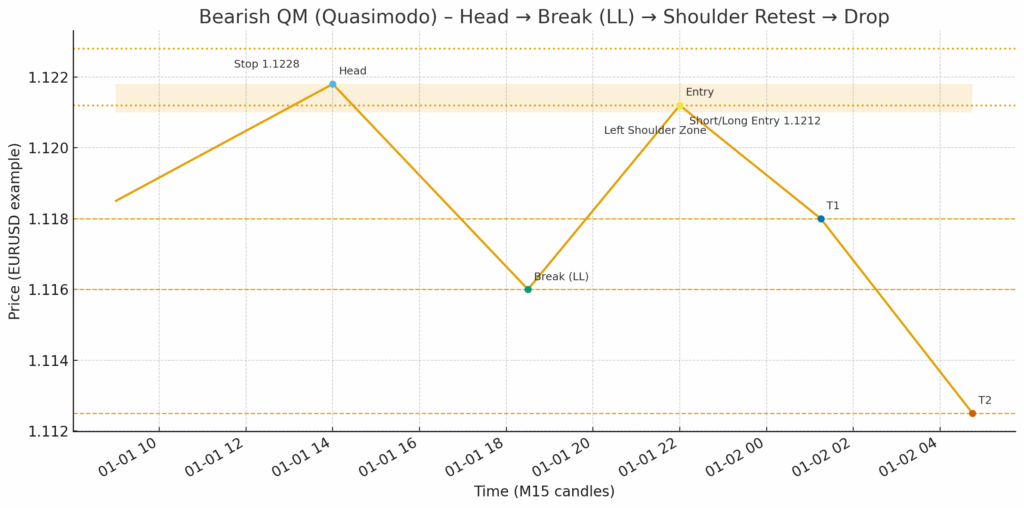
A Bullish QM Pattern and a Bearish QM Pattern describe the same Quasimodo reversal logic playing out in opposite directions. In a bullish QM, price comes from a downtrend, makes a final lower low the head, then shifts structure with a higher high before retracing to a left-shoulder demand zone for the long entry. In a bearish QM, price climbs in an uptrend, prints a final higher high the head, then breaks structure with a lower low and retests the left-shoulder supply for the short.
The key is sequence, head, then structure break, then shoulder retest plus clear invalidation beyond the shoulder. Use the bullish setup when seeking upside reversals from demand, and the bearish setup when timing downside turns from supply, ideally with confluence such as order blocks, breakers, or fair value gaps and alignment to higher timeframe bias.
Bullish QM Pattern signals a potential reversal up after a downtrend.

Bearish QM Pattern signals a potential reversal down after an uptrend.

Both are Quasimodo price action reversal structures: they require a structure break first, then a retest of the left shoulder for the entry.
| Feature | Bullish QM Pattern | Bearish QM Pattern |
| Previous Trend | Downtrend | Uptrend |
| Head | Lower Low (final push down) | Higher High (final push up) |
| Structure Break | Prints a Higher High over last swing | Prints a Lower Low under last swing |
| Left Shoulder Zone | Demand zone that launched the break | Supply zone that launched the break |
| Entry Idea | Long on first clean retest of shoulder with bullish rejection | Short on first clean retest of shoulder with bearish rejection |
| Invalidation | Close below shoulder extreme | Close above shoulder extreme |
| First Targets | Structure break level then prior swing highs | Structure break level then prior swing lows |
| Confluence | Demand + Order Block or Breaker + FVG fill | Supply + Order Block or Breaker + FVG fill |
How To Spot QM Pattern
- Identify the prevailing trend
- Mark the head the last higher high in an uptrend or lower low in a downtrend
- Confirm structure break price makes a decisive lower low after the head in an uptrend or higher high in a downtrend
- Find the left shoulder zone the origin of the leg that broke structure often a supply or demand pocket
- Wait for the return to the shoulder look for rejection wicks displacement or volume pickup
- Plan entries stops and targets as below.
Trading Rules You Can Test
Bearish QM Example
- Context EURUSD H1 is trending up to 1.1200 then prints a higher high at 1.1218 the head. Price sells off to 1.1160 breaking prior swing low structure break.
- Left shoulder 1.1210 to 1.1218 supply the origin of the break
- Entry Limit or confirmation short on retest of 1.1210 to 1.1218
- Stop loss 1.1228 ten pips above the shoulder extreme
- Targets: T1 1.1180 previous minor swing, T2 1.1160 structure break low, T3 1.1125 next H4 demand
- Risk management 0.5 to 1.0 percent account risk per trade scale out at T1 and trail behind lower highs
Bullish QM Example
- Context XAUUSD M30 is falling to 2362 the head then rallies to 2379 making a higher high over the last swing structure break
- Left shoulder 2368 to 2362 demand the origin of the break
- Entry Long on return to 2368 to 2362 upon bullish rejection
- Stop loss 2358 below the shoulder
- Targets 2388 then 2405 prior supply

QM Pattern Example
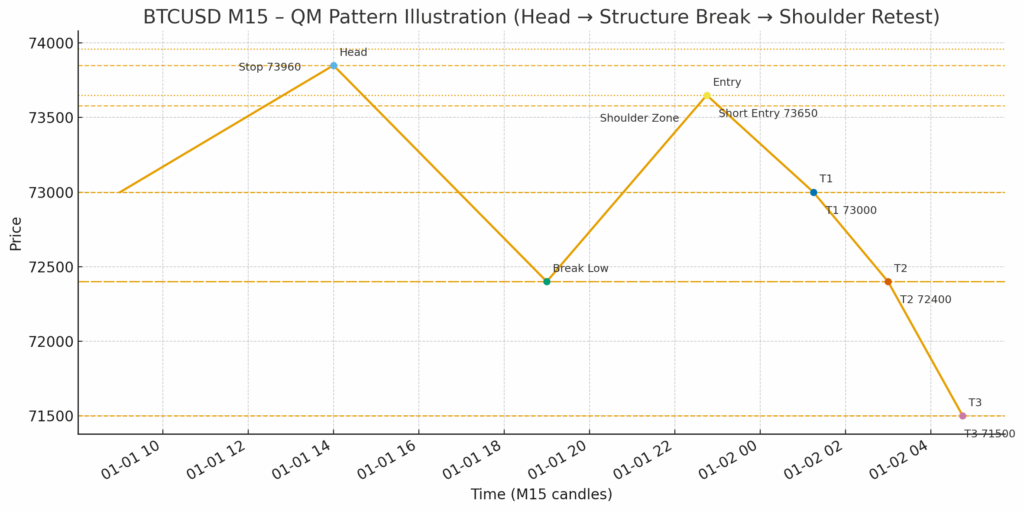
Imagine BTCUSD on the 15 minute chart
- Head 73850
- Break low 72400 below prior swing
- Shoulder 73580 to 73850
- Short entry 73650 limit
- Stop 73960 310 points risk
- Targets 73000 72400 71500
If T2 hits you bank about 2.0 R while T3 offers 6.9 R. This asymmetric profile is why many traders favour QM once they see the structure break.
Confluence That Improves QM Setups
Stacking the right confirmations turns a clean head, then structure break, then shoulder retest into a higher probability trade. Use the checklist below and aim to tick at least two boxes before executing.
Fresh Order Block or Breaker Block at the Shoulder
The shoulder works best when it overlaps a recent, unmitigated supply or demand pocket. A breaker block that flipped after the structure break adds conviction because it shows trapped flow at that level.
Fair Value Gap Near the Shoulder
If the break leg created an imbalance, a partial fill of that gap on the retest often kick starts the reaction. Prefer entries where the FVG sits inside or just in front of the shoulder zone.
Higher Timeframe Alignment
Trade the QM in the direction that aligns with the next higher timeframe. For example, take a bearish M15 QM if H1 is rejecting a resistance cluster or supply. This improves follow through and target depth.
Session Timing and News Awareness
Execute during the liquid session for your instrument. Avoid the first minutes after major releases to reduce spread spikes and slippage. If news is imminent, stand aside and reassess.
Conclusion
The QM pattern is a practical way to time reversals in forex trading with clear invalidation and measurable targets. Mark the head, confirm a real break of structure, then wait for price to revisit the left-shoulder zone before you act. In currency pairs like EURUSD, GBPJPY, and XAUUSD as a proxy for dollar flows, the best trades often come when the shoulder overlaps a fresh order block or breaker and the return tags a nearby fair value gap during liquid sessions.
At Ultima Markets, you can test this playbook on MT4 or MT5 using demo first, then transition to live once your screenshots and stats show consistency. Keep stops beyond the shoulder extreme, scale at the break level, and let higher timeframe bias guide your targets. Our Academy articles and platform tools are designed to help you build a repeatable process for the QM pattern across major and minor forex pairs.
Disclaimer: This content is provided for informational purposes only and does not constitute, and should not be construed as, financial, investment, or other professional advice. No statement or opinion contained here in should be considered a recommendation by Ultima Markets or the author regarding any specific investment product, strategy, or transaction. Readers are advised not to rely solely on this material when making investment decisions and should seek independent advice where appropriate.


