Important Information
This website is managed by Ultima Markets’ international entities, and it’s important to emphasise that they are not subject to regulation by the FCA in the UK. Therefore, you must understand that you will not have the FCA’s protection when investing through this website – for example:
- You will not be guaranteed Negative Balance Protection
- You will not be protected by FCA’s leverage restrictions
- You will not have the right to settle disputes via the Financial Ombudsman Service (FOS)
- You will not be protected by Financial Services Compensation Scheme (FSCS)
- Any monies deposited will not be afforded the protection required under the FCA Client Assets Sourcebook. The level of protection for your funds will be determined by the regulations of the relevant local regulator.
Note: UK clients are kindly invited to visit https://www.ultima-markets.co.uk/. Ultima Markets UK expects to begin onboarding UK clients in accordance with FCA regulatory requirements in 2026.
If you would like to proceed and visit this website, you acknowledge and confirm the following:
- 1.The website is owned by Ultima Markets’ international entities and not by Ultima Markets UK Ltd, which is regulated by the FCA.
- 2.Ultima Markets Limited, or any of the Ultima Markets international entities, are neither based in the UK nor licensed by the FCA.
- 3.You are accessing the website at your own initiative and have not been solicited by Ultima Markets Limited in any way.
- 4.Investing through this website does not grant you the protections provided by the FCA.
- 5.Should you choose to invest through this website or with any of the international Ultima Markets entities, you will be subject to the rules and regulations of the relevant international regulatory authorities, not the FCA.
Ultima Markets wants to make it clear that we are duly licensed and authorised to offer the services and financial derivative products listed on our website. Individuals accessing this website and registering a trading account do so entirely of their own volition and without prior solicitation.
By confirming your decision to proceed with entering the website, you hereby affirm that this decision was solely initiated by you, and no solicitation has been made by any Ultima Markets entity.
I confirm my intention to proceed and enter this website Please direct me to the website operated by Ultima Markets , regulated by the FCA in the United Kingdom
Ultima Markets App
Trade Anytime, Anywhere


The Put Call Ratio (PCR) is one of the most trusted sentiment indicators in the options market. By comparing the trading activity of put options to call options, it gives traders a snapshot of whether investors are feeling cautious or confident. With markets reacting sharply to interest rate decisions, inflation data, and earnings reports, PCR remains an essential tool for traders looking to measure crowd psychology and prepare for volatility.
What is Put Call Ratio?
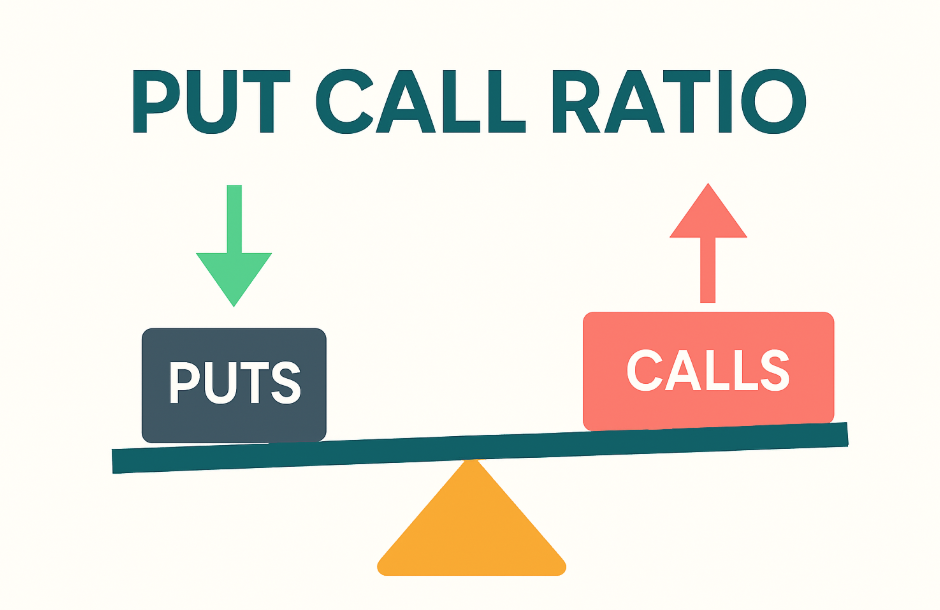
The Put Call Ratio (PCR) is a market sentiment indicator that compares the trading volume of put options to call options. It is calculated by dividing the number of traded puts by calls. A high ratio signals bearish sentiment, while a low ratio indicates bullish optimism.
- Put options gain value when an asset’s price falls.
- Call options gain value when an asset’s price rises.
By comparing these two, PCR shows whether investors are leaning more toward protection (puts) or speculation (calls). A high ratio suggests fear or bearishness, while a low ratio shows optimism.
Unlike many technical indicators, PCR reflects real market positioning rather than price patterns, which makes it especially useful during uncertain times.
How to Calculate the Put Call Ratio
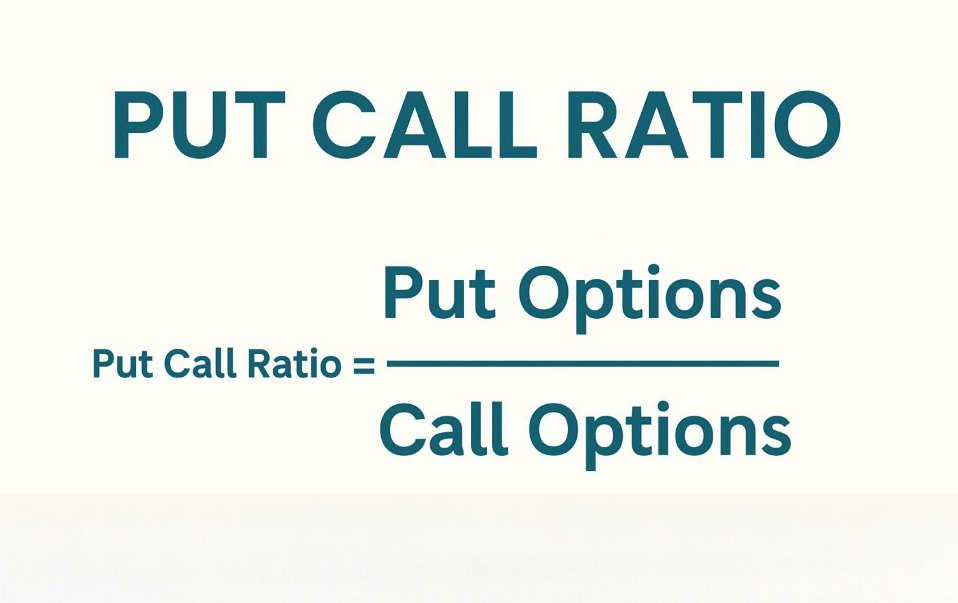
The Put Call Ratio (PCR) is calculated using a simple formula:
Put Call Ratio = Put Options/ Call Options
This means you divide the total number of traded put options by the total number of traded call options over a specific period (daily, weekly, or by open interest).
Example Calculation:
If 1,200,000 put contracts are traded and 1,000,000 call contracts are traded in a day:
PCR = 1,200,000/ 1,000,000
PCR = 1.2
A PCR of 1.2 shows that puts are being traded more than calls, signaling cautious or bearish positioning.
Types of PCR Calculations
- Volume-based PCR: Uses the number of puts and calls traded within a day.
- Open-Interest PCR: Uses the outstanding contracts that remain open, giving insight into longer-term positioning.
- Index vs Stock PCR: Index PCR reflects broader market sentiment, while individual stock PCR highlights sentiment toward specific companies.
In 2025, traders often use both daily PCR volume and open-interest PCR together for a clearer view of market sentiment.
How to Read the Put Call Ratio
The Put Call Ratio (PCR) is read by comparing its value to 1.0, which represents balance between puts and calls.
- PCR below 0.7: More calls than puts, Signals bullish sentiment.
- PCR between 0.7 and 1.0: Neutral sentiment, Market is balanced.
- PCR above 1.0: More puts than calls, Indicates bearish sentiment.
Traders often interpret extreme readings as contrarian signals:
- Very high PCR (>1.5): Excessive fear in the market, possible rebound ahead.
- Very low PCR (<0.5): Overconfidence, potential pullback risk.
PCR should not be read in isolation. In 2025, many traders combine PCR with:
- VIX (Volatility Index) for fear gauge.
- Technical levels like support and resistance.
- Macro events such as rate decisions or earnings reports.
In 2024–2025, CBOE data showed average equity PCR levels hovering around 0.8–1.0, meaning only sharp deviations outside this range stand out as meaningful signals.
What is a Good Put Call Ratio?
A good Put Call Ratio typically falls around 1.0, showing a balanced market. A ratio below 0.7 suggests bullish optimism, while a ratio above 1.0 signals bearish sentiment. Extreme levels under 0.5 or over 1.5 are often read as contrarian indicators of potential reversals.
Ultimately, a “good” PCR is one that aligns with your trading timeframe and strategy. Short-term traders may act on extremes, while long-term investors may use it as confirmation rather than a trigger.
Example: PCR in Market Action
To see the Put Call Ratio (PCR) in action, let’s look at how traders might interpret it during real events:
Example 1: Index PCR before a Fed meeting
Suppose the S&P 500’s daily PCR jumps to 1.6 ahead of a Federal Reserve interest rate decision. This shows traders are heavily buying puts for protection. If the Fed delivers a less aggressive policy, fear may quickly unwind, leading to a relief rally. Contrarian traders often see this as a bullish setup.
Example 2: Stock-specific PCR during earnings
Imagine Apple’s stock PCR rises to 1.3 just before earnings. Investors may be hedging against a possible miss. If results beat expectations, the rush to cover puts and buy calls could fuel a sharp upside move.
Example 3: Low PCR in a strong bull market
During a strong rally, a PCR of 0.5 may suggest traders are overly confident. While this reflects bullish sentiment, seasoned traders treat it as a warning sign that the market may be vulnerable to a pullback.
CBOE data shows PCR extremes are more common around macro events (Fed decisions, inflation reports) and earnings season, making it a timely tool for sentiment analysis.
Limitations of the Put Call Ratio
While the Put Call Ratio (PCR) is a powerful sentiment tool, it has several limitations that traders should be aware of:
- Doesn’t predict direction – PCR shows whether traders prefer puts or calls, but it does not guarantee which way prices will move.
- Extremes can persist – High or low ratios may last for weeks in strong bull or bear markets, making timing difficult.
- Different markets, different signals – An index PCR reflects broad sentiment, but stock-specific PCRs can be skewed by hedging or speculative activity.
- Overreliance risk – Using PCR alone may lead to false signals. Professional traders combine it with other tools such as VIX, moving averages, or macroeconomic data.
- Timeframe sensitivity – Daily PCR readings can show noise, while open-interest PCR may give a slower but steadier signal.
PCR is most effective when used as part of a broader strategy that includes technical indicators, volatility measures, and fundamental analysis.
Conclusion
The Put Call Ratio remains one of the most valuable sentiment indicators. By tracking the balance between puts and calls, traders can better understand whether fear or optimism dominates the market. While extremes in PCR can highlight potential turning points, it should never be used in isolation. Combining PCR with technical analysis, volatility measures, and key macro events gives a more reliable trading picture.
At Ultima Markets, we are committed to helping traders navigate complex market signals with clarity and confidence. Backed by global regulation and trusted trading platforms, we provide the tools and education you need to trade smarter, not harder.
Disclaimer: This content is provided for informational purposes only and does not constitute, and should not be construed as, financial, investment, or other professional advice. No statement or opinion contained here in should be considered a recommendation by Ultima Markets or the author regarding any specific investment product, strategy, or transaction. Readers are advised not to rely solely on this material when making investment decisions and should seek independent advice where appropriate.
Latest Articles


FOLLOW US


Ultima Markets is a member of The Financial Commission, an international independent body responsible for resolving disputes in the Forex and CFD markets.
All clients of Ultima Markets are protected under insurance coverage provided by Willis Towers Watson (WTW), a global insurance brokerage established in 1828, with claims eligibility up to US$1,000,000 per account.
Ultima Markets is the first United CFD broker to be part of the United Nations Global Compact.
FOLLOW US
TRADE WITH US
RISK DISCLOSURE
Risk Warning:
Trading leveraged financial products, including Contracts for Difference (CFDs), carries a high level of risk and may result in losses exceeding your initial investment. These products are not suitable for all investors and should only be traded with funds you can afford to lose. You do not own or have any rights to the underlying assets of these derivatives (e.g., entitlement to dividends). Please ensure you fully understand the associated risks. Before trading, consider your level of experience, investment objectives, and seek independent financial advice if necessary. Refer to our legal documents and disclosures before making any trading decisions.
General Advice Warning:
The information provided on this website is general in nature and does not take into account your personal objectives, financial situation, or needs. Before acting on any advice, you should assess its appropriateness in light of your individual circumstances and consult our legal documentation.
Regional Restrictions:
The information and services on this website are not intended for residents of certain jurisdictions, including but not limited to the United States, United Kingdom, Singapore, and any jurisdictions subject to international sanctions. For further information, please contact our customer support team.
Regulatory Information:
Ultima Markets is a trading name shared amongst multiple entities operating in various jurisdictions. These following entities are authorised to operate under the Ultima Markets brand and trademarks.
-
Ultima Markets UK Limited, reference number 470325, is authorised and regulated by the Financial Conduct Authority (FCA). Registered address: 1 Blossom Yard, Fourth Floor, London, E1 6RS, UNITED KINGDOM.
-
Ultima Markets Ltd is authorised and regulated by the Financial Services Commission (FSC) of Mauritius as a Full-Service Investment Dealer (excluding Underwriting), under licence number GB 23201593.
Registered address: 2nd Floor, The Catalyst, 40 Silicon Avenue, Ebene Cybercity, 72201, Mauritius.
-
Ultima Markets EU OÜ, incorporated in Estonia with registry code 17134727. Registered address: Harju maakond, Tallinn, Kristiine linnaosa, Seebi tn 1-1501, 11316. This entity does not offer regulated financial products or provide trading services.
Copyright © 2026 Ultima Markets Ltd. All rights reserved.
-

Messenger


Continue on Messenger
Take the conversation to your Messenger account. You can return anytime.
Scan the QR code and then send the message that appears in your Messenger.
Open Messenger on this device.
-

Instagram

Continue on Instagram
Take the conversation to your Instagram account. You can return anytime.
Scan the QR code to open Instagram. Follow @ultima_markets to send a DM.
Open Instagram on this device.
-

Live Chat
-
