Important Information
This website is managed by Ultima Markets’ international entities, and it’s important to emphasise that they are not subject to regulation by the FCA in the UK. Therefore, you must understand that you will not have the FCA’s protection when investing through this website – for example:
- You will not be guaranteed Negative Balance Protection
- You will not be protected by FCA’s leverage restrictions
- You will not have the right to settle disputes via the Financial Ombudsman Service (FOS)
- You will not be protected by Financial Services Compensation Scheme (FSCS)
- Any monies deposited will not be afforded the protection required under the FCA Client Assets Sourcebook. The level of protection for your funds will be determined by the regulations of the relevant local regulator.
Note: Ultima Markets is currently developing a dedicated website for UK clients and expects to onboard UK clients under FCA regulations in 2026.
If you would like to proceed and visit this website, you acknowledge and confirm the following:
- 1.The website is owned by Ultima Markets’ international entities and not by Ultima Markets UK Ltd, which is regulated by the FCA.
- 2.Ultima Markets Limited, or any of the Ultima Markets international entities, are neither based in the UK nor licensed by the FCA.
- 3.You are accessing the website at your own initiative and have not been solicited by Ultima Markets Limited in any way.
- 4.Investing through this website does not grant you the protections provided by the FCA.
- 5.Should you choose to invest through this website or with any of the international Ultima Markets entities, you will be subject to the rules and regulations of the relevant international regulatory authorities, not the FCA.
Ultima Markets wants to make it clear that we are duly licensed and authorised to offer the services and financial derivative products listed on our website. Individuals accessing this website and registering a trading account do so entirely of their own volition and without prior solicitation.
By confirming your decision to proceed with entering the website, you hereby affirm that this decision was solely initiated by you, and no solicitation has been made by any Ultima Markets entity.
I confirm my intention to proceed and enter this websiteWhat is the Money Flow Index
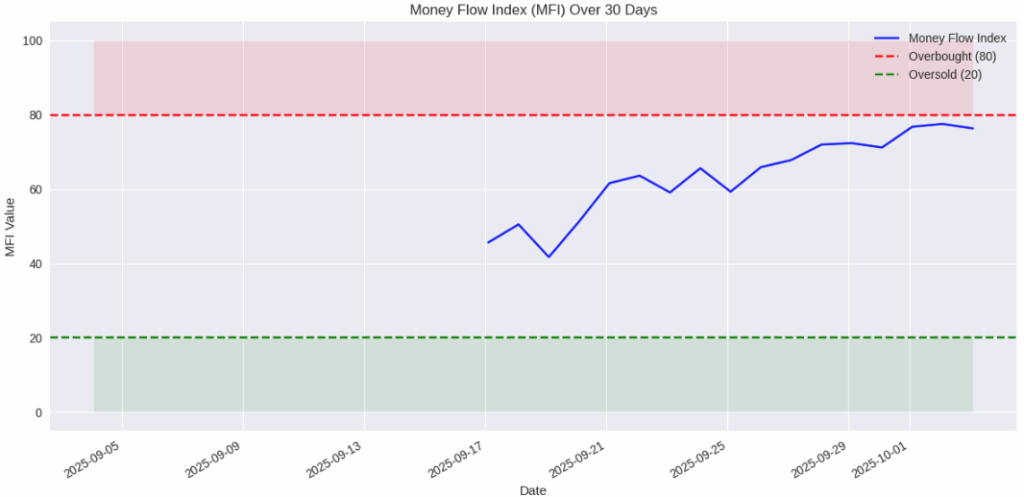
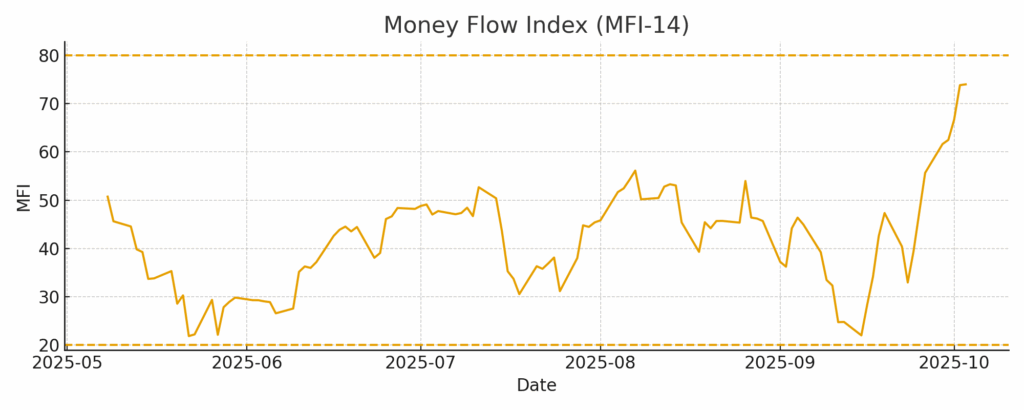
The Money Flow Index (MFI) is a volume-weighted momentum oscillator that uses price and volume to gauge buying vs. selling pressure. It ranges from 0–100, above 80 is commonly viewed as overbought, below 20 as oversold. Traders use MFI to spot divergences, potential reversals, and to confirm trend strength.
- Overbought level: Above 80 (potential reversal down)
- Oversold level: Below 20 (potential reversal up)
- Neutral zone: Between 20–80 (trend confirmation phase)
Traders rely on the MFI to detect hidden shifts in supply and demand that may not be visible in price action alone.

How the Money Flow Index Works
The Money Flow Index (MFI) is a momentum indicator that blends price and volume to reveal whether money is moving into or out of a market. Unlike many technical tools that only look at price, the MFI helps traders confirm whether a price move is backed by real buying or selling strength.
Positive vs Negative Money Flow
Positive Money Flow (Buying Pressure):
When today’s price is higher than yesterday’s and trading volume is strong, money is flowing into the asset. Example: a stock rises from $100 to $105 on heavy volume.
Negative Money Flow (Selling Pressure):
When today’s price is lower than yesterday’s with strong volume, money is flowing out of the asset. Example: a stock drops from $105 to $100 with big selling volume.

The MFI Oscillator Scale
The MFI converts this flow into an oscillator that ranges from 0 to 100:
- Above 80: Market is overbought and may pull back.
- Below 20: Market is oversold and may rebound.
- Between 20–80: Neutral zone that often confirms the current trend.
How to Read the Money Flow Index
Even for beginners, the MFI offers simple and practical insights:
- MFI rising while price is flat: accumulation (hidden buying pressure).
- MFI falling while price is flat: distribution (hidden selling pressure).
- MFI diverging from price: potential reversal signal.
- MFI at extreme levels (20/80): prepare for possible bounce or pullback.
This makes the MFI highly valuable for traders looking to confirm breakouts, spot exhaustion, or validate volume strength behind a move.

How to Calculate the Money Flow Index
To calculate the Money Flow Index (MFI), you combine price and volume data to measure buying and selling pressure. The formula has four steps:
- Typical Price (TP) = (High + Low + Close) ÷ 3
- Raw Money Flow (RMF) = TP × Volume
- Separate RMF into Positive Money Flow (if TP is higher than the previous TP) and Negative Money Flow (if TP is lower).
- Money Ratio = (Sum of Positive MF ÷ Sum of Negative MF), MFI = 100 − [100 ÷ (1 + Money Ratio)]
Example Calculation
Let’s calculate a short 3-day MFI (normally 14 periods are used):
- Day 1 TP = 19, RMF = 19,000
- Day 2 TP = 20.67, RMF = 24,804, Positive
- Day 3 TP = 21.5, RMF = 32,250, Positive
- Day 4 TP = 19.5, RMF = 25,350, Negative
Positive Flow = 24,804 + 32,250 = 57,054
Negative Flow = 25,350
Money Ratio = 57,054 ÷ 25,350 = 2.25
MFI = 100 − [100 ÷ (1 + 2.25)] = 69.2
An MFI of 69.2 suggests buying pressure, but not yet overbought (80+).
Trading Strategies with the Money Flow Index
The Money Flow Index (MFI) is not just about spotting overbought or oversold zones. It can also help traders confirm trends, detect hidden market strength, and validate breakouts. Below are some of the most effective MFI trading strategies:
Overbought and Oversold Reversals
- Above 80: Overbought: When MFI climbs above 80, it signals heavy buying pressure. This doesn’t always mean an immediate sell, but it warns of possible exhaustion and a pullback.
- Below 20: Oversold: When MFI drops below 20, it indicates strong selling pressure. Often, this is followed by a short-term rebound as selling momentum slows.
Don’t rely on overbought/oversold levels alone. Combine with candlestick patterns or support/resistance zones for stronger confirmation.
Divergence Trading
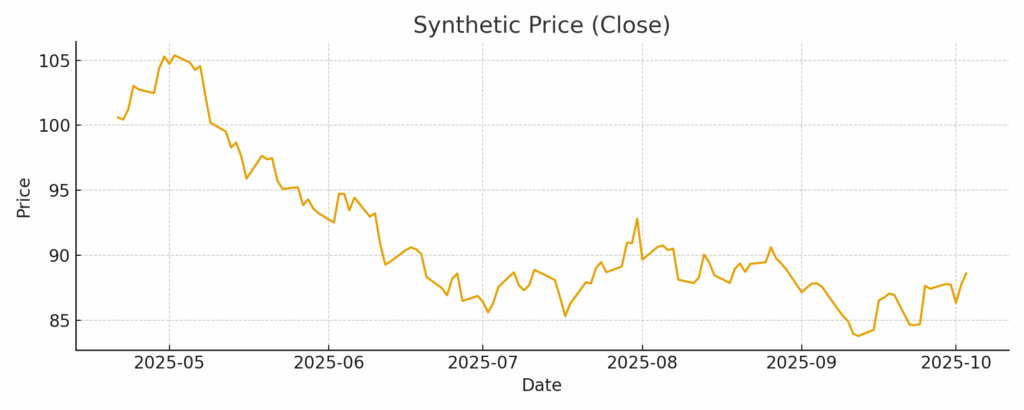
- Bearish Divergence: Price makes higher highs, but MFI forms lower highs, signals weakening buying pressure, potential reversal downward.
- Bullish Divergence: Price makes lower lows, but MFI forms higher lows, shows selling pressure is fading, potential upward reversal.
Divergences are stronger on higher timeframes (daily/weekly) and can act as early warning signals before a trend change.
Trend Confirmation
- If MFI holds between 40–60 during an uptrend, it suggests steady accumulation and trend continuation.
- In a downtrend, if MFI stays weak (20–40), it confirms consistent selling pressure.
Use MFI together with a moving average (e.g., 50-day MA). If MFI supports the direction of the MA, the trend is likely stronger.
Breakout Validation
- When price breaks above a resistance level, check if MFI is rising too.
- A breakout with strong MFI = high probability it will continue.
- A breakout with flat or falling MFI = risk of a false breakout.
Apply this strategy on high-volume assets (e.g., forex majors, top stocks, gold) where MFI volume signals are more reliable.
MFI vs RSI: What’s the Difference?
The Relative Strength Index (RSI) and Money Flow Index (MFI) are often compared, but they are not the same.
| Feature | MFI | RSI |
| Inputs | Price + Volume | Price only |
| Sensitivity | More sensitive due to volume | Less sensitive |
| Best Use | Confirming moves with volume | Price momentum only |
| Signals | Overbought/Oversold, Divergence | Overbought/Oversold, Divergence |
The MFI adds a volume dimension to RSI, making it a more reliable tool for confirming whether a price move is backed by real market participation. Many professional traders use RSI + MFI together for stronger confirmation signals.
Limitations of the Money Flow Index
Like any indicator, the MFI is not perfect:
- False signals can occur during low-volume trading periods.
- Works best when combined with trend indicators like moving averages.
- Should not be used in isolation, always confirm with price action.
Conclusion
The Money Flow Index (MFI) is more than just an overbought/oversold indicator. It’s a valuable tool that blends price and volume to reveal the true strength behind market moves. By learning how to calculate it, applying divergence and breakout strategies, and combining it with other indicators like RSI, traders can gain an edge in spotting hidden opportunities and avoiding false signals.
At Ultima Markets, we believe knowledge is a trader’s most powerful tool. That’s why we provide not only a secure and regulated trading environment but also access to educational resources, market insights, and expert analysis to help you understand indicators like the Money Flow Index and apply them with confidence.
Disclaimer: This content is provided for informational purposes only and does not constitute, and should not be construed as, financial, investment, or other professional advice. No statement or opinion contained here in should be considered a recommendation by Ultima Markets or the author regarding any specific investment product, strategy, or transaction. Readers are advised not to rely solely on this material when making investment decisions and should seek independent advice where appropriate.


