Important Information
This website is managed by Ultima Markets’ international entities, and it’s important to emphasise that they are not subject to regulation by the FCA in the UK. Therefore, you must understand that you will not have the FCA’s protection when investing through this website – for example:
- You will not be guaranteed Negative Balance Protection
- You will not be protected by FCA’s leverage restrictions
- You will not have the right to settle disputes via the Financial Ombudsman Service (FOS)
- You will not be protected by Financial Services Compensation Scheme (FSCS)
- Any monies deposited will not be afforded the protection required under the FCA Client Assets Sourcebook. The level of protection for your funds will be determined by the regulations of the relevant local regulator.
Note: UK clients are kindly invited to visit https://www.ultima-markets.co.uk/. Ultima Markets UK expects to begin onboarding UK clients in accordance with FCA regulatory requirements in 2026.
If you would like to proceed and visit this website, you acknowledge and confirm the following:
- 1.The website is owned by Ultima Markets’ international entities and not by Ultima Markets UK Ltd, which is regulated by the FCA.
- 2.Ultima Markets Limited, or any of the Ultima Markets international entities, are neither based in the UK nor licensed by the FCA.
- 3.You are accessing the website at your own initiative and have not been solicited by Ultima Markets Limited in any way.
- 4.Investing through this website does not grant you the protections provided by the FCA.
- 5.Should you choose to invest through this website or with any of the international Ultima Markets entities, you will be subject to the rules and regulations of the relevant international regulatory authorities, not the FCA.
Ultima Markets wants to make it clear that we are duly licensed and authorised to offer the services and financial derivative products listed on our website. Individuals accessing this website and registering a trading account do so entirely of their own volition and without prior solicitation.
By confirming your decision to proceed with entering the website, you hereby affirm that this decision was solely initiated by you, and no solicitation has been made by any Ultima Markets entity.
I confirm my intention to proceed and enter this website Please direct me to the website operated by Ultima Markets , regulated by the FCA in the United Kingdom
Ultima Markets App
Trade Anytime, Anywhere


Marubozu Candle Explained for Traders
When you’re scanning a candlestick chart, most candles show a tug of war: a body in the middle and wicks on both ends, signalling pushback from buyers and sellers.
A marubozu candle is different. It’s a clean momentum candle with a long body and little to no wicks, suggesting one side controlled the session from open to close.
That makes it useful, but only if you apply it with structure, confirmation, and a clear plan. Below is what the marubozu candlestick pattern is, what it’s really saying about market behaviour, and how traders use it effectively without falling into common traps.
What Is a Marubozu Candle?
A marubozu is a candlestick defined by a long real body and no shadows (wicks), or wicks so small they’re negligible relative to the body.
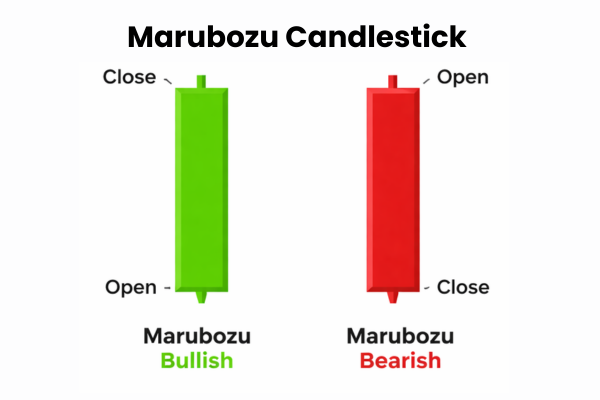
Bullish vs Bearish Marubozu
A marubozu can be bullish or bearish:
- Bullish Marubozu (White or Green): Open ≈ Low, Close ≈ High. Buyers stayed in control throughout the session.
- Bearish Marubozu (Black or Red): Open ≈ High, Close ≈ Low. Sellers stayed in control throughout the session.
In plain English, marubozu candles are momentum candles. They show aggressive directional pressure and minimal rejection of the extremes.
Types of Marubozu Candles
In real markets, not every marubozu is “perfect.” That’s why many trading guides discuss variants.
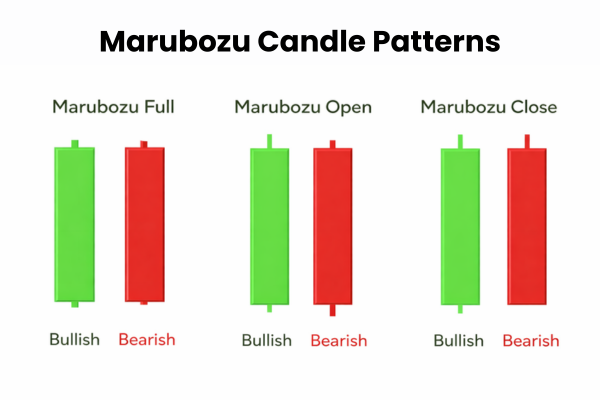
1) Full Marubozu
A full marubozu has no wicks at all, just a strong body.
2) Opening Marubozu
An opening marubozu shows dominance from the start:
- Bullish: the open is the low
- Bearish: the open is the high
3) Closing Marubozu
A closing marubozu highlights conviction into the close, often closing at (or extremely near) the session extreme, with limited wick on the closing side.
4) “Near Marubozu” (practical reality)
Many traders treat candles as marubozu-like if wicks are tiny compared to the body.
What the Marubozu Candle Is Really Saying
A marubozu candle is a story of control:
- A bullish marubozu suggests buyers kept lifting price with little meaningful pullback.
- A bearish marubozu suggests sellers kept pressing price lower without meaningful rebound.
That clean structure is what gives the candle its value: it’s a quick visual summary of who had the upper hand.
But here’s the nuance: a marubozu shows what happened during that interval, not what must happen next. The best traders treat it as a confirmation tool, not a standalone buy or sell signal.
How Traders Use the Marubozu Candle Effectively
1) Breakout Confirmation at Key Levels
A marubozu can help confirm that a breakout is not just a quick spike.
Why it works: a strong marubozu breakout suggests price did not merely poke through a level. It showed acceptance and held into the close.
Simple framework:
- Mark a level: range high or low, prior swing, trendline, or major moving average zone.
- Wait for a marubozu candle to close strongly through the level.
- Use the candle’s extremes as reference points.
Many traders watch the high and low of the marubozu as key reference levels after it prints.
Entry options:
- Aggressive: enter near the close of the marubozu candle.
- Conservative: wait for follow-through (break of the marubozu high or low) or a retest of the level.
Stop placement (common):
- Bullish setup: stop below the marubozu low
- Bearish setup: stop above the marubozu high
This turns one candle into a structured trade: level → confirmation → entry trigger → defined risk.
2) Trend Continuation After a Pause
Marubozu candles often show up when a trend transitions from resting back to moving.
A typical continuation sequence looks like this:
- Uptrend → small consolidation or pullback → bullish marubozu
- Downtrend → pause or range → bearish marubozu
Repeatable approach:
- Confirm trend direction on a higher timeframe.
- Wait for a pause (tight range, flag, or pullback).
- Use the marubozu as a “go” candle that signals control has returned.
Entry triggers:
- Break above bullish marubozu high (or below bearish marubozu low).
- If it matches your style, add a trend filter such as moving averages and look for a strong close through the relevant area.
3) Retest Strategy: Use the Marubozu High or Low as a Decision Level
A huge edge in trading often comes from not chasing. Marubozu candles can be exciting, but late entries can be punished by pullbacks.
A patient method is to treat the marubozu extremes as levels:
- Bullish marubozu low as a support reference
- Bearish marubozu high as a resistance reference
How it looks:
- A strong marubozu breaks out or resumes trend.
- Price pulls back.
- You watch whether it respects the marubozu extreme (or even the body midpoint) before entering.
Some strategy guides describe a “retracement breakout” idea: identify a marubozu aligned with the trend, then wait for a brief retracement before continuation.
Why traders like it: it often improves reward-to-risk and reduces “FOMO entries.”
4) Reversal Clues
Marubozu can sometimes hint at reversals, but this is where traders get trapped if they rely on the candle alone.
A reversal idea is usually based on location:
- Bearish marubozu after a long uptrend may reflect exhaustion
- Bullish marubozu after a long downtrend may reflect a sentiment shift
Some charting libraries group marubozu-like candles under a Belt Hold concept and stress that context matters.
How to reduce false reversals:
- Don’t trade it in isolation. Look for confirmation (structure shift, key level reclaim or loss, or other evidence that control truly changed).
- Consider waiting for the next candle to confirm follow-through.
Confirmation Filters That Make Marubozu More Reliable
Because marubozu candles are visually dramatic, traders often overestimate them. Apply a few consistent filters:
- Trend context: generally stronger when aligned with the trend or at a clear turning point.
- Support or resistance location: stronger at meaningful levels, weaker in the middle of a range.
- Volume or participation: low participation can make the signal less trustworthy.
- Wait for the close: a candle can look like a marubozu mid-session and change by close.
Risk Management for the Marubozu Candle
If you want to use marubozu candles effectively, your risk plan should be just as clear as the candle itself.
Stop-loss placement (common, simple)
- Bullish marubozu setup: stop below the candle’s low
- Bearish marubozu setup: stop above the candle’s high
Position sizing tip
Marubozu candles are often large. A larger candle usually implies a wider stop, so many traders reduce position size to keep risk consistent.
Profit-taking ideas
- Next major support or resistance zone
- Measured move (height of the prior range projected)
- Trailing stop using swing lows or highs
- Partial profit plus runner approach
Quick Checklist
Before acting on a marubozu candle, ask:
- Is it aligned with the trend (or at a major turning point)?
- Did it occur at a clear support or resistance level?
- Is the body meaningfully larger than recent candles?
- Did it close strongly (not just intrabar)?
- Do you have a defined entry trigger and a clear stop (often beyond the candle’s extreme)?

If you can’t answer these, you’re not trading a setup. You’re trading a shape.
FAQ
It can be either. A bullish marubozu closes near the high (open near the low), while a bearish marubozu closes near the low (open near the high).
Most often it’s treated as a continuation or confirmation candle, but it can hint at reversal when it forms at major turning points and is confirmed by other signals.
Most guides caution against using it in isolation. It’s typically strongest when paired with trend context, key levels, and confirmation.
Disclaimer: This content is provided for informational purposes only and does not constitute, and should not be construed as, financial, investment, or other professional advice. No statement or opinion contained here in should be considered a recommendation by Ultima Markets or the author regarding any specific investment product, strategy, or transaction. Readers are advised not to rely solely on this material when making investment decisions and should seek independent advice where appropriate.
Latest Articles


FOLLOW US


Ultima Markets is a member of The Financial Commission, an international independent body responsible for resolving disputes in the Forex and CFD markets.
All clients of Ultima Markets are protected under insurance coverage provided by Willis Towers Watson (WTW), a global insurance brokerage established in 1828, with claims eligibility up to US$1,000,000 per account.
Ultima Markets is the first United CFD broker to be part of the United Nations Global Compact.
FOLLOW US
TRADE WITH US
RISK DISCLOSURE
Risk Warning:
Trading leveraged financial products, including Contracts for Difference (CFDs), carries a high level of risk and may result in losses exceeding your initial investment. These products are not suitable for all investors and should only be traded with funds you can afford to lose. You do not own or have any rights to the underlying assets of these derivatives (e.g., entitlement to dividends). Please ensure you fully understand the associated risks. Before trading, consider your level of experience, investment objectives, and seek independent financial advice if necessary. Refer to our legal documents and disclosures before making any trading decisions.
General Advice Warning:
The information provided on this website is general in nature and does not take into account your personal objectives, financial situation, or needs. Before acting on any advice, you should assess its appropriateness in light of your individual circumstances and consult our legal documentation.
Regional Restrictions:
The information and services on this website are not intended for residents of certain jurisdictions, including but not limited to the United States, United Kingdom, Singapore, and any jurisdictions subject to international sanctions. For further information, please contact our customer support team.
Regulatory Information:
Ultima Markets is a trading name shared amongst multiple entities operating in various jurisdictions. These following entities are authorised to operate under the Ultima Markets brand and trademarks.
-
Ultima Markets UK Limited, reference number 470325, is authorised and regulated by the Financial Conduct Authority (FCA). Registered address: 1 Blossom Yard, Fourth Floor, London, E1 6RS, UNITED KINGDOM.
-
Ultima Markets Ltd is authorised and regulated by the Financial Services Commission (FSC) of Mauritius as a Full-Service Investment Dealer (excluding Underwriting), under licence number GB 23201593.
Registered address: 2nd Floor, The Catalyst, 40 Silicon Avenue, Ebene Cybercity, 72201, Mauritius.
-
Ultima Markets EU OÜ, incorporated in Estonia with registry code 17134727. Registered address: Harju maakond, Tallinn, Kristiine linnaosa, Seebi tn 1-1501, 11316. This entity does not offer regulated financial products or provide trading services.
Copyright © 2026 Ultima Markets Ltd. All rights reserved.
-

Messenger


Continue on Messenger
Take the conversation to your Messenger account. You can return anytime.
Scan the QR code and then send the message that appears in your Messenger.
Open Messenger on this device.
-

Instagram

Continue on Instagram
Take the conversation to your Instagram account. You can return anytime.
Scan the QR code to open Instagram. Follow @ultima_markets to send a DM.
Open Instagram on this device.
-

Live Chat
-
