
Ultima Markets App
Trade Anytime, Anywhere
Important Information
This website is managed by Ultima Markets’ international entities, and it’s important to emphasise that they are not subject to regulation by the FCA in the UK. Therefore, you must understand that you will not have the FCA’s protection when investing through this website – for example:
- You will not be guaranteed Negative Balance Protection
- You will not be protected by FCA’s leverage restrictions
- You will not have the right to settle disputes via the Financial Ombudsman Service (FOS)
- You will not be protected by Financial Services Compensation Scheme (FSCS)
- Any monies deposited will not be afforded the protection required under the FCA Client Assets Sourcebook. The level of protection for your funds will be determined by the regulations of the relevant local regulator.
Note: Ultima Markets is currently developing a dedicated website for UK clients and expects to onboard UK clients under FCA regulations in 2026.
If you would like to proceed and visit this website, you acknowledge and confirm the following:
- 1.The website is owned by Ultima Markets’ international entities and not by Ultima Markets UK Ltd, which is regulated by the FCA.
- 2.Ultima Markets Limited, or any of the Ultima Markets international entities, are neither based in the UK nor licensed by the FCA.
- 3.You are accessing the website at your own initiative and have not been solicited by Ultima Markets Limited in any way.
- 4.Investing through this website does not grant you the protections provided by the FCA.
- 5.Should you choose to invest through this website or with any of the international Ultima Markets entities, you will be subject to the rules and regulations of the relevant international regulatory authorities, not the FCA.
Ultima Markets wants to make it clear that we are duly licensed and authorised to offer the services and financial derivative products listed on our website. Individuals accessing this website and registering a trading account do so entirely of their own volition and without prior solicitation.
By confirming your decision to proceed with entering the website, you hereby affirm that this decision was solely initiated by you, and no solicitation has been made by any Ultima Markets entity.
I confirm my intention to proceed and enter this website Please direct me to the website operated by Ultima Markets , regulated by the FCA in the United Kingdom

What is MACD? Key Forex Indicator to Master Trading Timing!
In the fast-paced rhythm of the forex market, finding a technical indicator that helps you timely grasp buy and sell opportunities is crucial. The MACD (Moving Average Convergence/Divergence) is a trusted technical analysis tool widely used by professional traders and beginners alike. This article will deeply analyze the MACD’s operating principles, application techniques, and practical strategies to help you respond more accurately to market fluctuations.
What is MACD?
MACD (Moving Average Convergence/Divergence) is a technical indicator that uses the convergence and divergence between the short-term and long-term exponential moving averages (EMAs) of closing prices to help investors identify price trends, measure trend momentum, and determine entry points for buying or selling.
Developed by American Gerald Appel in the 1970s, MACD is one of the most popular technical analysis tools, widely available on most online stock broker trading platforms.
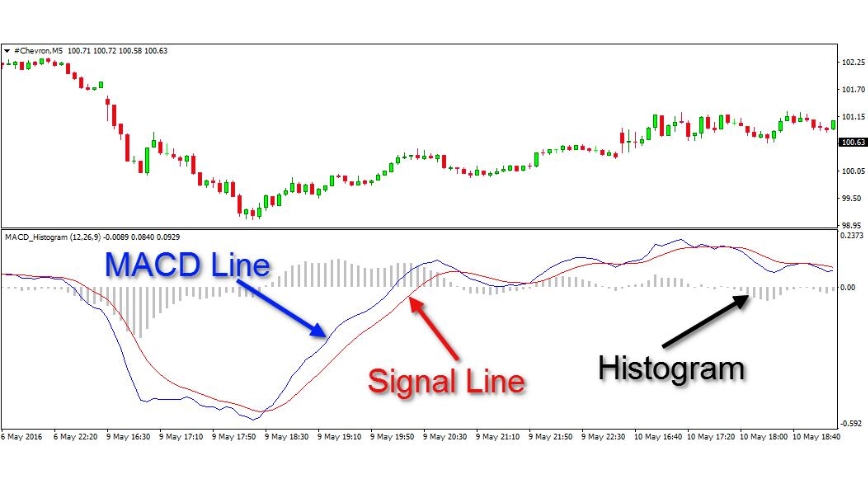
MACD consists of three components:
- DIF (fast line, MACD line): the difference between the 12-day EMA and the 26-day EMA.
- DEA (slow line, signal line): the 9-day EMA of the DIF line.
- MACD histogram: a graphical representation of the difference between DIF and DEA, reflecting shifts in buying and selling pressure. Red bars indicate a positive difference between the two lines, while green bars indicate a negative difference.
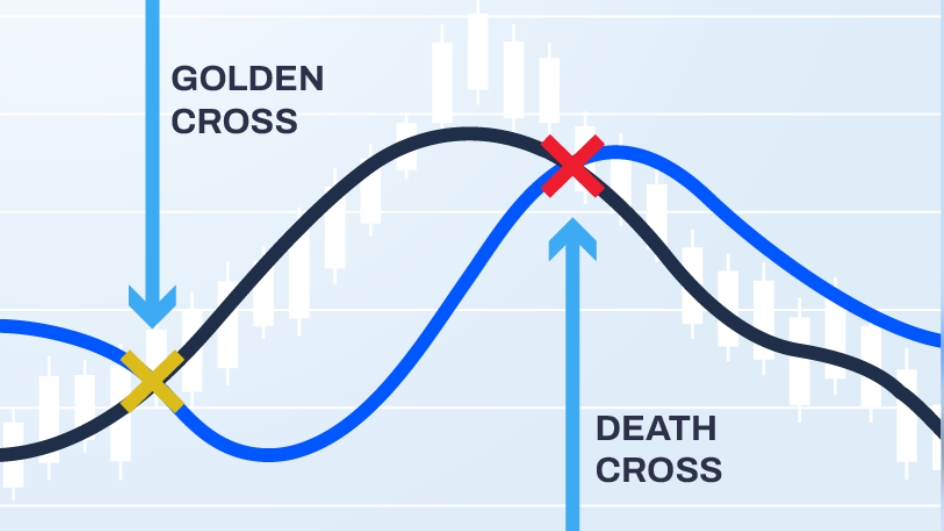
For example, when the DIF line crosses above the DEA line, it indicates a potential shift from a bearish to a bullish market, forming what is known as a “golden cross.” Conversely, when the DIF line crosses below the DEA line, it forms a “death cross,” which may signal a bearish trend reversal.
MACD Calculation Formula
While most trading platforms like MT4, MT5, or the Ultima Markets App automatically calculate the MACD for you, understanding its calculation helps deepen your insight:
- DIF = EMA(12) – EMA(26)
- DEA = EMA(DIF, 9)
- MACD Histogram = DIF – DEA
The EMA responds more quickly to recent price changes, making MACD a clear signal generator during trend reversals. According to the latest market analysis reports, MACD remains one of the top three most frequently used technical indicators in global forex trading.
How to Read MACD? Identifying Buy and Sell Signals with MACD
To effectively use MACD, it’s crucial to understand the interaction between its three key components. This helps identify potential market entry and exit points:
Golden Cross (DIF crosses above DEA):
When the DIF (fast line) crosses above the DEA (slow line), and the histogram turns from negative to positive, it signals a potential trend reversal from weakness to strength. This is commonly viewed as a buy signal.
Death Cross (DIF crosses below DEA):
When the DIF crosses below the DEA, and the histogram flips from positive to negative, it indicates a shift from strength to weakness. This is typically seen as a sell signal.
Histogram Turns from Negative to Positive / Positive to Negative:
This signals a short-term buy or sell opportunity, indicating a potential trend reversal. When the histogram gradually shrinks toward 0 and changes from green to red (red bars represent positive values, green bars represent negative values), it indicates a golden cross; conversely, when the histogram shrinks toward 0 and changes from red to green, it suggests a death cross.
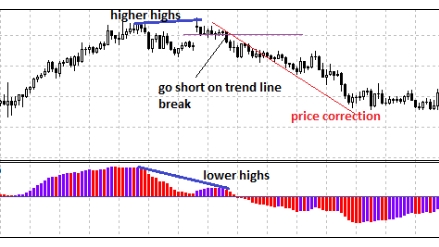
Divergence Phenomenon:
MACD divergence (also called discrepancy) refers to a situation where the MACD indicator’s movement opposes the trend shown by the candlestick (price) chart. For example, when the price reaches a new high but the MACD does not, it may signal a potential trend reversal.
- Bearish Divergence (Top Divergence):
This occurs when the stock price chart shows higher highs, indicating continued upward movement, but the MACD line (fast line) shows lower highs compared to previous peaks. In other words, if the stock price hits a new high while the MACD line’s peak is lower than its previous peak, it forms a bearish divergence. This typically indicates that the stock is about to reverse from a high level, signaling the end of the uptrend and a potential downward reversal. It is considered a sell signal. The more frequently bearish divergence appears, the higher the risk of reversal, so it’s important to avoid risk in a timely manner.
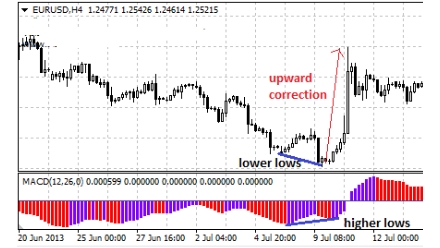
- Bullish Divergence (Bottom Divergence):
Bottom divergence typically occurs when a stock is trading at a low price range. It happens when the price action continues to decline, forming lower lows on the candlestick chart, while the MACD line (fast line) forms higher lows compared to previous levels. In other words, when the stock price makes a lower low, but the MACD indicator forms a higher low, this is called a bullish divergence. This phenomenon often indicates that the downtrend may be nearing its end and that a reversal to the upside could be imminent. It is considered a short-term buy signal. The more frequently bullish divergence appears, the stronger the potential for a rebound. In such cases, there’s no need to sell at a loss in panic. Instead, when the market shows a clear surge with volume, it may be a good opportunity to enter a long position.
MACD Application Example
Take the EUR/USD trend in February 2025 as an example. After the European Central Bank announced a rate cut, the currency pair formed a golden cross on the MACD chart, accompanied by expanding histogram bars. As a result, the pair rallied over the next three trading days, making this a classic case where the MACD signal accurately predicted a trend reversal.
Advantages and Limitations of MACD
Advantages:
- Simple and intuitive, suitable for traders of all levels.
- Effective in identifying medium- to long-term trends, less affected by short-term market noise.
- Can be combined with other technical indicators such as RSI and Bollinger Bands for enhanced analysis.
Limitations:
- Lagging nature, may miss optimal entry or exit points.
- In sideways or ranging markets, frequent golden or death crosses can occur, leading to false signals.
Therefore, experts recommend combining MACD with volume indicators, candlestick patterns, or professional analysis reports like Trading Central from the UM platform to increase strategy accuracy.
Advantages of Using MACD with the Ultima Markets Trading Platform
Using the Ultima Markets platform to apply MACD strategies offers the following key benefits:
- Full MACD Indicator Support: Whether on MT4, MT5, WebTrader, or the UM proprietary app, the platform automatically displays MACD indicators and allows custom parameter settings for more precise control.
- Integrated with Trading Central: Get access to actionable MACD-based entry and exit signals. This is especially valuable in 2025’s volatile environment driven by AI developments and frequent central bank policy shifts.
- Automated Trading Capability: Leverage the EA (Expert Advisor) system to fully automate MACD strategies. With an average execution speed of under 20 milliseconds, you can seize every trading opportunity with precision.
- Robust Fund Protection: Client funds are segregated at Westpac Bank Australia and protected by the Financial Commission Compensation Fund (offering up to €20,000) in coverage per client.
How New Traders Can Start Using MACD?
If you’re new to the forex market, you can begin learning to use MACD with the following steps:
- Open a UM Demo Account: Get free $100,000 virtual funds to practice MACD trading strategies risk-free.
- Set Standard MACD Parameters: Use the default settings of 12, 26, and 9 as a starting point for beginners.
- Learn to Identify Crossovers and Divergences: Use the platform’s tutorials and Trading Central charts for guidance.
- Develop a Disciplined Trading Strategy: Always set stop-loss orders for each trade to avoid emotional decisions.
Conclusion
MACD is a time-tested technical analysis tool that provides traders with valuable trend insights, especially in the highly volatile forex market. Whether you are a beginner just starting out or an experienced trader seeking strategy optimization, MACD is an indispensable tool.
In a trading environment full of risks and opportunities, choosing a powerful and comprehensive trading platform is crucial. Ultima Markets not only offers advanced MACD tools and smart trading technology but also provides a demo account and 24/7 Chinese customer support, allowing you to confidently embark on your professional trading journey.
👉 Register your Ultima Markets account now to experience MACD trading strategies for free and start your path to profits!
Disclaimer: This content is provided for informational purposes only and does not constitute, and should not be construed as, financial, investment, or other professional advice. No statement or opinion contained here in should be considered a recommendation by Ultima Markets or the author regarding any specific investment product, strategy, or transaction. Readers are advised not to rely solely on this material when making investment decisions and should seek independent advice where appropriate.
Latest Articles

FOLLOW US


Ultima Markets is a member of The Financial Commission, an international independent body responsible for resolving disputes in the Forex and CFD markets.
All clients of Ultima Markets are protected under insurance coverage provided by Willis Towers Watson (WTW), a global insurance brokerage established in 1828, with claims eligibility up to US$1,000,000 per account.
Ultima Markets is the first United CFD broker to be part of the United Nations Global Compact.
FOLLOW US
TRADE WITH US
RISK DISCLOSURE
Risk Warning:
Trading leveraged financial products, including Contracts for Difference (CFDs), carries a high level of risk and may result in losses exceeding your initial investment. These products are not suitable for all investors and should only be traded with funds you can afford to lose. You do not own or have any rights to the underlying assets of these derivatives (e.g., entitlement to dividends). Please ensure you fully understand the associated risks. Before trading, consider your level of experience, investment objectives, and seek independent financial advice if necessary. Refer to our legal documents and disclosures before making any trading decisions.
General Advice Warning:
The information provided on this website is general in nature and does not take into account your personal objectives, financial situation, or needs. Before acting on any advice, you should assess its appropriateness in light of your individual circumstances and consult our legal documentation.
Regional Restrictions:
The information and services on this website are not intended for residents of certain jurisdictions, including but not limited to the United States, United Kingdom, Singapore, and any jurisdictions subject to international sanctions. For further information, please contact our customer support team.
Regulatory Information:
Ultima Markets is a trading name shared amongst multiple entities operating in various jurisdictions. These following entities are authorised to operate under the Ultima Markets brand and trademarks.
-
Ultima Markets UK Limited, reference number 470325, is authorised and regulated by the Financial Conduct Authority (FCA). Registered address: 1 Blossom Yard, Fourth Floor, London, E1 6RS, UNITED KINGDOM.
-
Ultima Markets Ltd is authorised and regulated by the Financial Services Commission (FSC) of Mauritius as a Full-Service Investment Dealer (excluding Underwriting), under licence number GB 23201593.
Registered address: 2nd Floor, The Catalyst, 40 Silicon Avenue, Ebene Cybercity, 72201, Mauritius.
Copyright © 2026 Ultima Markets Ltd. All rights reserved.
-

Messenger


Continue on Messenger
Take the conversation to your Messenger account. You can return anytime.
Scan the QR code and then send the message that appears in your Messenger.
Open Messenger on this device.
-

Instagram

Continue on Instagram
Take the conversation to your Instagram account. You can return anytime.
Scan the QR code to open Instagram. Follow @ultima_markets to send a DM.
Open Instagram on this device.
-

Live Chat
-
