This website is managed by Ultima Markets’ international entities, and it’s important to emphasise that they are not subject to regulation by the FCA in the UK. Therefore, you must understand that you will not have the FCA’s protection when investing through this website – for example:
You will not be guaranteed Negative Balance Protection
You will not be protected by FCA’s leverage restrictions
You will not have the right to settle disputes via the Financial Ombudsman Service (FOS)
You will not be protected by Financial Services Compensation Scheme (FSCS)
Any monies deposited will not be afforded the protection required under the FCA Client Assets Sourcebook. The level of protection for your funds will be determined by the regulations of the relevant local regulator.
Note: UK clients are kindly invited to visit https://www.ultima-markets.co.uk/. Ultima Markets UK expects to begin onboarding UK clients in accordance with FCA regulatory requirements in 2026.
If you would like to proceed and visit this website, you acknowledge and confirm the following:
1.The website is owned by Ultima Markets’ international entities and not by Ultima Markets UK Ltd, which is regulated by the FCA.
2.Ultima Markets Limited, or any of the Ultima Markets international entities, are neither based in the UK nor licensed by the FCA.
3.You are accessing the website at your own initiative and have not been solicited by Ultima Markets Limited in any way.
4.Investing through this website does not grant you the protections provided by the FCA.
5.Should you choose to invest through this website or with any of the international Ultima Markets entities, you will be subject to the rules and regulations of the relevant international regulatory authorities, not the FCA.
Ultima Markets wants to make it clear that we are duly licensed and authorised to offer the services and financial derivative products listed on our website. Individuals accessing this website and registering a trading account do so entirely of their own volition and without prior solicitation.
By confirming your decision to proceed with entering the website, you hereby affirm that this decision was solely initiated by you, and no solicitation has been made by any Ultima Markets entity.
A stock heat map gives traders a real-time visual snapshot of market performance by sector and cap. Learn how to read, use it, and make smarter trades.
If you have ever wanted to understand the entire stock market at a single glance, a stock heat map is one of the most powerful tools you can add to your trading routine.
It transforms thousands of live data points into a colour-coded visual display, letting you instantly see which sectors are surging, which are falling, and where momentum is shifting.
In a market where sector rotation has been described as “violent” by analysts at Charles Schwab, and where the leadership playbook has changed dramatically heading into mid-2026, knowing how to read and use a stock heat map is no longer optional. It is essential.
What Is a Stock Heat Map?
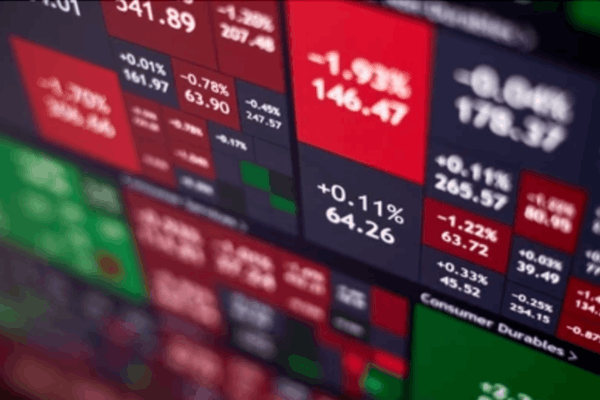
A stock heat map is a two-dimensional visual tool that uses colour intensity to represent the strength of price movements, trading volume, volatility, or market capitalisation across a group of stocks.
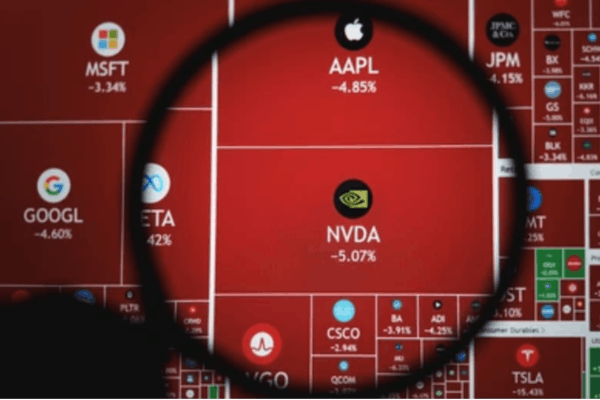
Each company is displayed as a coloured rectangle. Green signals a price gain, red signals a loss, and the size of each block reflects the company’s market cap, so heavyweight names like Nvidia, Apple, and Microsoft naturally take up more space on the map.
The concept has been around since the 19th century as a statistical analysis tool, but it gained widespread adoption during the 2008 financial crisis, when analysts used it to track shifting foreclosure rates across markets in real time.
Today, it covers everything from the S&P 500 and Nasdaq 100 to global indices and individual sectors.
The Four Types of Stock Heat Map
Not all heat maps are built the same, and knowing which type to use makes a real difference.
Price heat maps are the most common. They show the percentage price change of each stock over a selected timeframe, making it easy to spot sector leaders, laggards, and potential reversals at a glance.
Volume heat maps show how actively a stock is being traded, with darker colours representing heavier activity. Comparing price and volume together helps you judge whether a move is backed by genuine participation or is simply a low-conviction blip.
Liquidity and order book heat maps are used by more advanced traders. Rather than showing historical price action, they visualise the current placement and size of limit buy and sell orders at specific price levels, helping identify key support and resistance zones before price even gets there.
Each type serves a different purpose, and the best traders use more than one.
How to Read a Stock Heat Map
Reading a stock heat map is straightforward once you understand its core elements. Colour intensity tells you the strength of the move: deep green means strong upward momentum, deep red means significant selling pressure, and lighter shades reflect smaller changes.
Block size reflects market cap, so larger companies will always dominate the visual space. Stocks are grouped by sector, such as Technology, Energy, Financials, and Healthcare, which makes it easy to identify sector-wide trends. Most platforms also display the percentage change directly on each block, combining a visual and numerical read in one place.
One important thing to note is that timeframe selection changes everything. An intraday heat map highlights short-term momentum, while a weekly or monthly view reveals sustained trends and rotation. Most platforms let you toggle between intraday, daily, weekly, monthly, and year-to-date views, so aligning your timeframe to your trading style is key.
How to Use the Stock Heat Map for Trading
The real value of a stock heat map comes from how you apply it, not just how you read it.
Start with sector momentum
Before placing any trade, scan which sectors are leading and which are lagging. In 2026, this has proven especially important. Energy stocks are up more than 22% year-to-date, Industrials have gained over 16%, and Consumer Defensives are up 13.3%, while Technology is currently the worst-performing sector, down 0.40% year-to-date after dominating throughout most of 2025. A heat map would have shown this rotation clearly weeks before it became headline news.
Look for outliers within sectors
Even in a broadly red sector, some stocks will be holding green. These are often showing relative strength driven by an earnings catalyst, an analyst upgrade, or quiet institutional accumulation. They are worth investigating further before the wider market catches on.
Use volume to confirm your read
A stock showing green on price but low volume may not be telling you the full story. Cross-referencing the price heat map with the volume heat map helps separate high-conviction moves from noise.
Check your portfolio exposure
Portfolio managers use heat maps to quickly assess sector concentration relative to a benchmark, identify names with unusual activity, and rebalance before risk builds up in one area. Even for retail traders, a quick daily scan can flag when a position is sitting in a sector that has quietly turned against you.
Stock Heat Map vs. Traditional Screeners
A stock screener tells you which stocks meet a set of pre-defined criteria. A stock heat map tells you where the market is moving right now. Both are useful, but they serve different purposes.
The most effective approach is to use them together. Scan the heat map to identify which sector has momentum, then run a screener within that sector to find the best individual setups. The heat map gives you context and direction; the screener gives you the shortlist.
Best Platforms to Access a Stock Heat Map
Several platforms offer strong heat map tools, each with different strengths:
TradingView covers 84 global exchanges with over 45 fundamental and technical filters and has a community of more than 20 million active users. It is the most widely used option for traders at all levels.
Finviz offers a free US market heat map alongside a world heat map covering 24 global stock exchanges, with mini-charts that pop up on hover. The free version is genuinely useful; Finviz Elite adds real-time data.
TrendSpider offers over 58 selectable criteria across stocks, ETFs, currencies, cryptocurrencies, and sectors, making it a strong option for traders who want flexibility across asset classes.
Barchart provides both sector and industry heat maps across multiple timeframes, from single-day to 52-week performance, with options to size blocks by P/E ratio, EPS, or dividend yield rather than just market cap.
Common Mistakes to Avoid
Even experienced traders can misread a heat map if they are not careful. The most common mistake is using it in isolation. Heat maps show price performance and volume, not underlying fundamentals or news context, so always combine them with additional analysis before acting.
Chasing the darkest colours is another trap. A deeply red stock may look like a buying opportunity, but without checking volume and recent news, you risk stepping into a falling position with no support.
Similarly, ignoring timeframe context means a one-day map and a three-month map can tell completely opposite stories about the same stock.
Finally, do not let block size create bias. Because small-cap stocks are visually compressed on most maps, they are easy to overlook, even when they are showing strong relative performance.
Conclusion
A stock heat map distils complex, multi-stock market data into a format that communicates direction, sector strength, and volume behaviour in seconds.
For traders on Ultima Markets, adding a quick heat map scan to your pre-market routine is one of the simplest ways to build a stronger daily market plan.
With sector rotation continuing to dominate the 2026 trading environment, the ability to see the full market picture at a glance, and act on it before the crowd does, is a genuine edge worth developing.
FAQs
What does a stock heat map show?
It shows the real-time price performance of stocks or sectors using colour-coded blocks. Green means gains, red means losses, and block size reflects market capitalisation.
What are the different types of stock heat maps?
The four main types are price, volume, liquidity, and order book heat maps. Each highlights a different aspect of market activity, from price momentum to where large buy and sell orders are sitting.
Can a stock heat map be used for day trading?
Yes. Day traders use it to spot early sector movers, confirm volume behind a price move, and gauge overall market sentiment before entering or exiting a position.
Disclaimer: This content is provided for informational purposes only and does not constitute, and should not be construed as, financial, investment, or other professional advice. No statement or opinion contained here in should be considered a recommendation by Ultima Markets or the author regarding any specific investment product, strategy, or transaction. Readers are advised not to rely solely on this material when making investment decisions and should seek independent advice where appropriate.
Thank you for visiting the Ultima Markets website. Please note that this website is intended for individuals residing in jurisdictions where accessing is permitted by law. Ultima and its affiliated entities do not operate in your home jurisdictions.
By clicking on ''Acknowledge'', you confirm that you are entering this website solely based on your initiative and not as a result of any specific marketing outreach. You wish to obtain information from this website based on reverse solicitation principles, in accordance with the applicable laws of your home jurisdiction.