Important Information
This website is managed by Ultima Markets’ international entities, and it’s important to emphasise that they are not subject to regulation by the FCA in the UK. Therefore, you must understand that you will not have the FCA’s protection when investing through this website – for example:
- You will not be guaranteed Negative Balance Protection
- You will not be protected by FCA’s leverage restrictions
- You will not have the right to settle disputes via the Financial Ombudsman Service (FOS)
- You will not be protected by Financial Services Compensation Scheme (FSCS)
- Any monies deposited will not be afforded the protection required under the FCA Client Assets Sourcebook. The level of protection for your funds will be determined by the regulations of the relevant local regulator.
Note: Ultima Markets is currently developing a dedicated website for UK clients and expects to onboard UK clients under FCA regulations in 2026.
If you would like to proceed and visit this website, you acknowledge and confirm the following:
- 1.The website is owned by Ultima Markets’ international entities and not by Ultima Markets UK Ltd, which is regulated by the FCA.
- 2.Ultima Markets Limited, or any of the Ultima Markets international entities, are neither based in the UK nor licensed by the FCA.
- 3.You are accessing the website at your own initiative and have not been solicited by Ultima Markets Limited in any way.
- 4.Investing through this website does not grant you the protections provided by the FCA.
- 5.Should you choose to invest through this website or with any of the international Ultima Markets entities, you will be subject to the rules and regulations of the relevant international regulatory authorities, not the FCA.
Ultima Markets wants to make it clear that we are duly licensed and authorised to offer the services and financial derivative products listed on our website. Individuals accessing this website and registering a trading account do so entirely of their own volition and without prior solicitation.
By confirming your decision to proceed with entering the website, you hereby affirm that this decision was solely initiated by you, and no solicitation has been made by any Ultima Markets entity.
I confirm my intention to proceed and enter this website

How to Read Candlestick Charts: Beginner’s Guide with Practical Tips
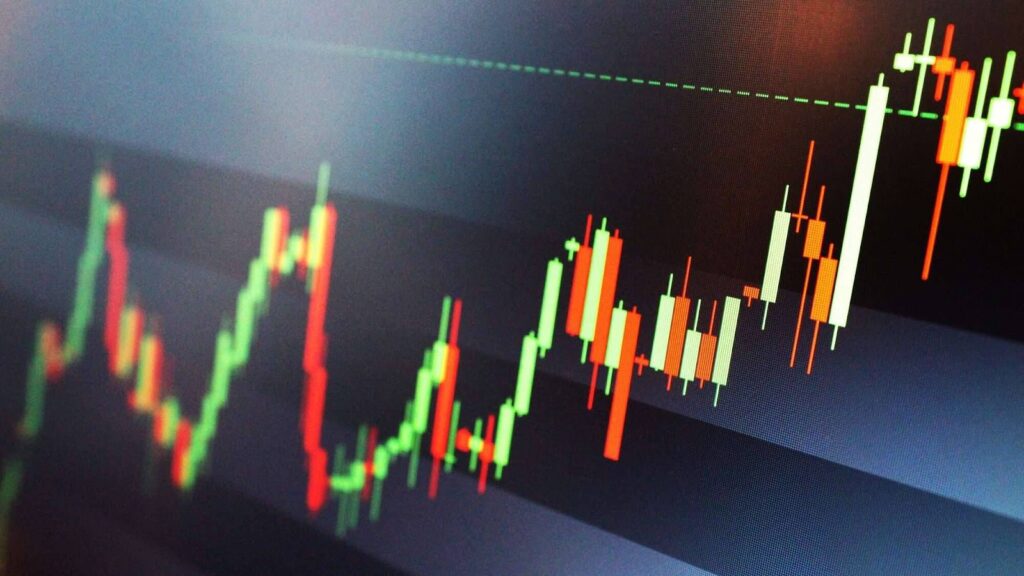
In technical analysis, knowing how to read a candlestick chart is fundamental for every trader entering the market. Whether you are trading in the forex, stock, or cryptocurrency markets, candlestick charts are the most intuitive and practical charting tool.
In this article, we will guide you through the structure, reading techniques, and application strategies of candlestick charts. Combined with the Ultima Markets trading platform, this content is designed to help you start from scratch and gradually build your own trading strategy.
What is a Candlestick Chart?
A candlestick chart, also known as a K-line chart, originated in Japan during the Edo period in the 18th century. It was invented by Munehisa Homma for tracking rice prices and was later introduced to Western markets by technical analyst Steve Nison. Today, it is widely used in stocks, futures, forex, and cryptocurrency trading.
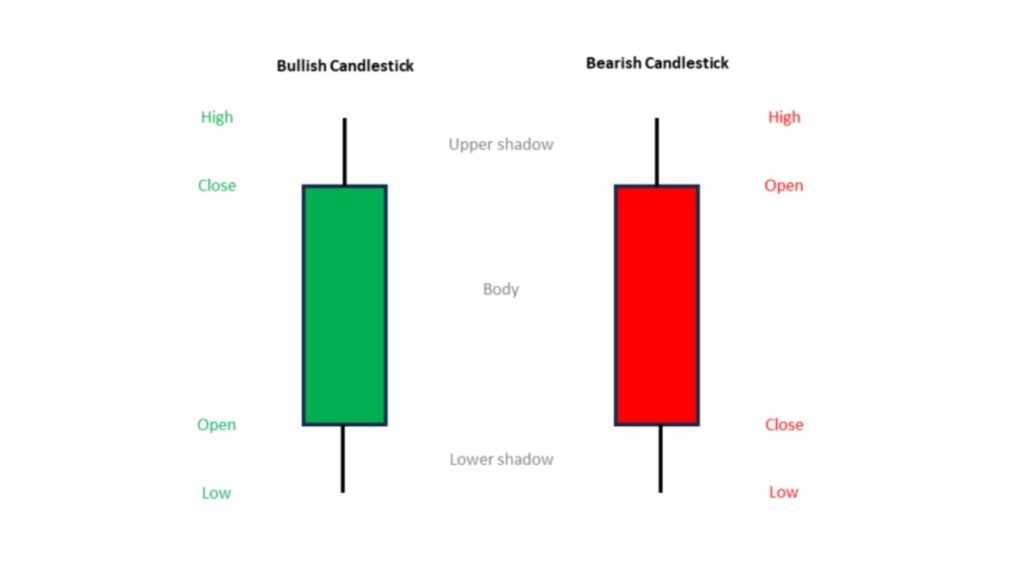
Each candlestick represents price movement within a specific time frame. For example, a daily candlestick reflects the opening price, highest price, lowest price, and closing price for that day.
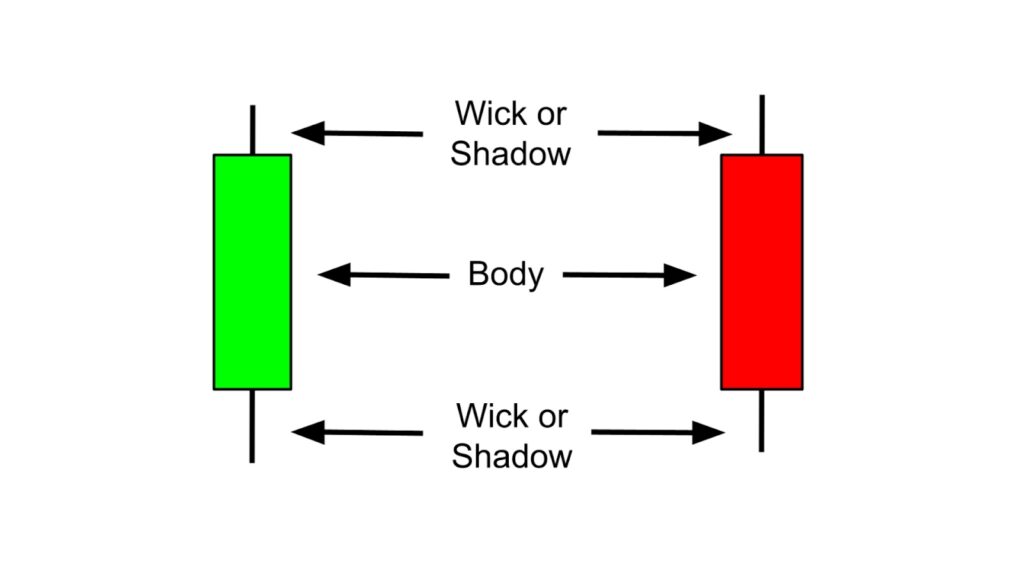
A candlestick consists of the body and the shadow:
- Body: connects the opening and closing prices; its length shows the strength of bullish or bearish momentum;
- Upper/lower shadow: represents the highest and lowest prices of the period, indicating the range of price fluctuations;
- Color: in the Taiwan market, red indicates a bullish candle, while green indicates a bearish one.
For the question “how to interpret the body and shadows of a candlestick,” understanding the structure of the candlestick itself is the first step in forming any technical judgment.
How to Read a Candlestick Chart? Step-by-Step Guide
To understand how to read a candlestick chart, one must begin by analyzing the shape of individual candlesticks. Below are four essential aspects you should not miss:
Observe the body length and color:
- Long bullish candle (red) = strong buying power;
- Long bearish candle (green) = selling pressure dominates;
- Small-bodied candles (e.g., doji) suggest a balance between buyers and sellers and may indicate a reversal.
Interpretation of upper and lower shadows:
- A long lower shadow with a long body indicates strong support below;
- A long upper shadow with a closing price near the bottom signals intensified selling pressure.
Combine volume with candlestick analysis:
- An increase in trading volume combined with a breakout candlestick often signals the start of a strong trend.
Identify single and multiple candlestick patterns:
- Single-candle patterns: morning star, evening star, doji, etc.;
- Multiple-candle patterns: three white soldiers, three methods, etc., often indicate the continuation or reversal of a mid- to short-term trend.
In addition, observing volume in tandem makes it easier to identify genuine breakouts or false signals. Such analysis can be supported by built-in technical indicators available on the MT4/MT5 platforms offered by Ultima Markets, which is especially helpful for beginners.
Common Candlestick Patterns Explained
When learning how to analyze common candlestick patterns, traders often focus on formations that can indicate potential trend reversals. Recognizing these patterns helps in identifying key signals from a candlestick chart. Below are several basic patterns:
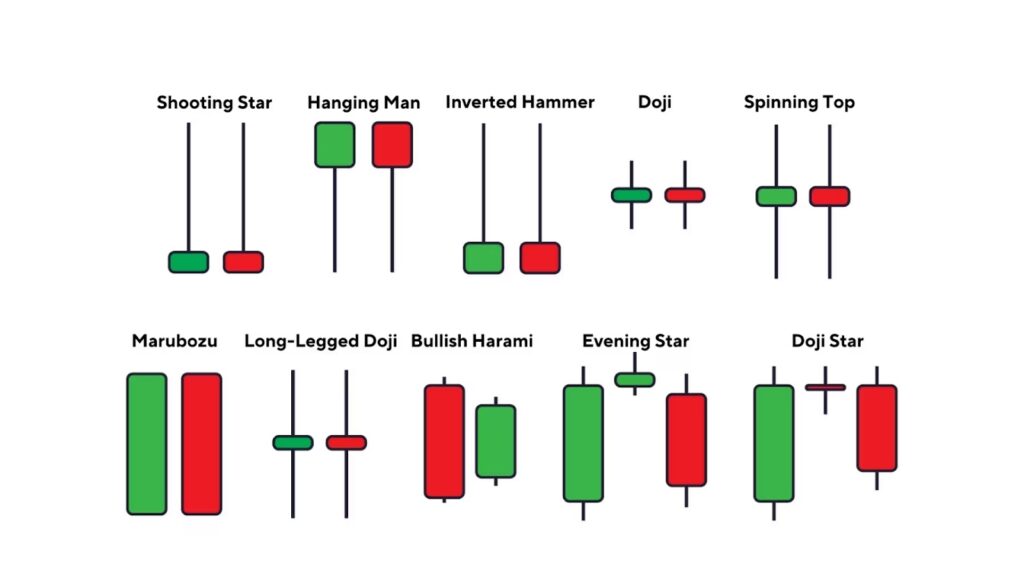
Hammer and Doji
- Hammer / Hanging Man: characterized by a long lower shadow and a small body, suggesting an attempt at rebound from lower levels;
- Doji: where the open and close prices are nearly the same, indicating a standoff between bulls and bears, and possibly marking the beginning of a reversal.
Engulfing Pattern
- Bullish Engulfing: a large bullish candle completely engulfs the previous bearish one, indicating a strong reversal to the upside;
- Bearish Engulfing: the opposite pattern may signal a downward reversal.
Three White Soldiers and Three Methods Pattern
- Three White Soldiers: a strong continuation signal;
- Three Methods: typically appears during a trend, representing a brief consolidation before continuing in the original direction.
These patterns should not be interpreted in isolation. Instead, they must be evaluated in conjunction with preceding and subsequent candlesticks, as well as volume. The built-in Trading Central analysis tool on the Ultima Markets platform can automatically detect these patterns and provide technical suggestions, helping users make smarter decisions in real time.
Differences in Candlestick Chart Application Between Stocks and Forex
Although candlestick charts are universally applied across asset classes, there are subtle distinctions in how they are interpreted for stock trading versus forex trading.
Forex Market Characteristics
The forex market operates 24 hours a day, so price gaps are less common. Timeframes like M15, H1, H4, and D1 are frequently used by traders, with a greater emphasis on trend continuity.
Stock Market Characteristics
Stocks have fixed daily opening and closing hours. Price movement is influenced by earnings reports, institutional investor behavior, and overall liquidity conditions, making price gaps more frequent. Stock analysis often combines candlestick patterns with fundamental analysis and focuses more on daily candlesticks and volume shifts.
How to Read Candlestick Charts Across Different Timeframes?
- Daily candlesticks are suitable for short- to medium-term trading;
- Weekly and monthly candlesticks are better for identifying long-term trends.
UM supports MT4/MT5 and the UM App, offering round-the-clock trading with customizable chart timeframes. It is an ideal environment for practicing and comparing daily versus weekly candlestick interpretations.
Combining Candlestick Charts with Support and Resistance Levels to Build a Personalized Strategy
Candlestick charts alone are not sufficient to build a complete trading plan. They must be paired with support and resistance analysis.
Support levels are price areas where a downtrend may pause or reverse, while resistance levels are where upward price movement may stall. When a candlestick breaks through one of these key zones, it can trigger a strong trend continuation.
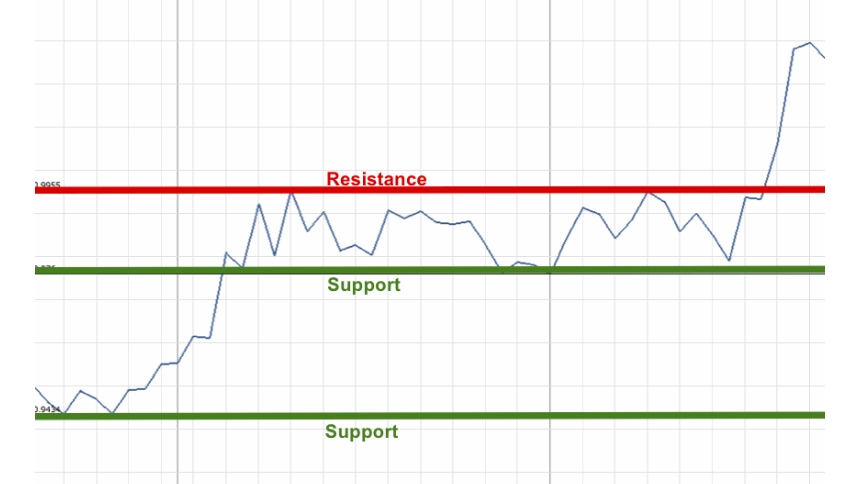
How to Draw Support and Resistance Lines on a Candlestick Chart
Mastering the drawing of support and resistance lines on candlestick charts allows traders to analyze entry and exit points using candlesticks and horizontal lines together:
- Identify range highs and lows: connect previous highs to form resistance lines and lows to form support levels.
- Observe breakout signals:
- A price breaking above resistance, accompanied by a long bullish candle and rising volume, is a suitable entry signal.
- A drop below support with a long bearish candle and increased volume may signal a need to hedge or short.
- Use RSI and MACD as supplementary indicators to enhance success rates.
By combining these tools, seemingly random candlestick signals can be transformed into actionable trading strategies. Ultima Markets’ charting tools support one-click line drawing and price alerts, ideal for traders requiring real-time responsiveness.
How to Read Candlestick Charts More Accurately?
According to most market surveys, technical analysis remains one of the most commonly used trading approaches globally. Among these tools, candlestick charts are highly popular in both forex and equity markets due to their intuitive and visual clarity.
However, relying solely on visual observation has limitations, and platform-based tools offer effective support. Ultima Markets’ demo account allows traders to simulate real candlestick trading scenarios, complete with built-in expert advisors (EAs) and alert systems, ideal for investors developing systematic strategies.
Why Choose Ultima Markets?
Choosing Ultima Markets ensures safer and more efficient trading. Whether you’re a beginner or an advanced trader, you can access professional tools, demo accounts, and 24/7 Chinese-speaking support for a comprehensive trading experience.
- Demo account: get $100,000 in virtual funds to practice candlestick pattern analysis and support/resistance drawing without any risk.
- 24-hour access to MT4/MT5, WebTrader, and UM App: switch between daily, weekly, and monthly charts to clearly compare timeframes.
- Built-in charting tools: automatically detect common candlestick patterns and integrate volume, RSI, and MACD for more precise trading.
- Real trading with low entry threshold: easily transition from demo to trading account with a seamless process.
With these features, UM is the go-to platform for beginners entering technical analysis.
Conclusion
Latest data from 2025 shows that technical analysis remains a key method for improving win rates. If you’re ready to take the next step, it’s recommended to open a demo account on Ultima Markets to practice everything from reading candlestick charts to executing full strategies. Learning through simulation and progressing in live markets is the key path for many traders to gain traction quickly.
Disclaimer: This content is provided for informational purposes only and does not constitute, and should not be construed as, financial, investment, or other professional advice. No statement or opinion contained here in should be considered a recommendation by Ultima Markets or the author regarding any specific investment product, strategy, or transaction. Readers are advised not to rely solely on this material when making investment decisions and should seek independent advice where appropriate.
Latest Articles


FOLLOW US


Ultima Markets is a member of The Financial Commission, an international independent body responsible for resolving disputes in the Forex and CFD markets.
All clients of Ultima Markets are protected under insurance coverage provided by Willis Towers Watson (WTW), a global insurance brokerage established in 1828, with claims eligibility up to US$1,000,000 per account.
Ultima Markets is the first United CFD broker to be part of the United Nations Global Compact.
FOLLOW US
TRADE WITH US
RISK DISCLOSURE
Risk Warning:
Trading leveraged financial products, including Contracts for Difference (CFDs), carries a high level of risk and may result in losses exceeding your initial investment. These products are not suitable for all investors and should only be traded with funds you can afford to lose. You do not own or have any rights to the underlying assets of these derivatives (e.g., entitlement to dividends). Please ensure you fully understand the associated risks. Before trading, consider your level of experience, investment objectives, and seek independent financial advice if necessary. Refer to our legal documents and disclosures before making any trading decisions.
General Advice Warning:
The information provided on this website is general in nature and does not take into account your personal objectives, financial situation, or needs. Before acting on any advice, you should assess its appropriateness in light of your individual circumstances and consult our legal documentation.
Regional Restrictions:
The information and services on this website are not intended for residents of certain jurisdictions, including but not limited to the United States, Singapore, and any jurisdictions subject to international sanctions. For further information, please contact our customer support team.
Regulatory Information:
Ultima Markets is a trading name shared amongst multiple entities operating in various jurisdictions. These following entities are authorised to operate under the Ultima Markets brand and trademarks.
-
Ultima Markets UK Limited, reference number 470325, is authorised and regulated by the Financial Conduct Authority (FCA). Registered address: 1 Blossom Yard, Fourth Floor, London, E1 6RS, UNITED KINGDOM.
-
Ultima Markets Ltd is authorised and regulated by the Financial Services Commission (FSC) of Mauritius as a Full-Service Investment Dealer (excluding Underwriting), under licence number GB 23201593.
Registered address: 2nd Floor, The Catalyst, 40 Silicon Avenue, Ebene Cybercity, 72201, Mauritius.
Copyright © 2025 Ultima Markets Ltd. All rights reserved.
-

Messenger


Continue on Messenger
Take the conversation to your Messenger account. You can return anytime.
Scan the QR code and then send the message that appears in your Messenger.
Open Messenger on this device.
-

Instagram

Continue on Instagram
Take the conversation to your Instagram account. You can return anytime.
Scan the QR code to open Instagram. Follow @ultima_markets to send a DM.
Open Instagram on this device.
-

Live Chat
-
