Important Information
This website is managed by Ultima Markets’ international entities, and it’s important to emphasise that they are not subject to regulation by the FCA in the UK. Therefore, you must understand that you will not have the FCA’s protection when investing through this website – for example:
- You will not be guaranteed Negative Balance Protection
- You will not be protected by FCA’s leverage restrictions
- You will not have the right to settle disputes via the Financial Ombudsman Service (FOS)
- You will not be protected by Financial Services Compensation Scheme (FSCS)
- Any monies deposited will not be afforded the protection required under the FCA Client Assets Sourcebook. The level of protection for your funds will be determined by the regulations of the relevant local regulator.
Note: Ultima Markets is currently developing a dedicated website for UK clients and expects to onboard UK clients under FCA regulations in 2026.
If you would like to proceed and visit this website, you acknowledge and confirm the following:
- 1.The website is owned by Ultima Markets’ international entities and not by Ultima Markets UK Ltd, which is regulated by the FCA.
- 2.Ultima Markets Limited, or any of the Ultima Markets international entities, are neither based in the UK nor licensed by the FCA.
- 3.You are accessing the website at your own initiative and have not been solicited by Ultima Markets Limited in any way.
- 4.Investing through this website does not grant you the protections provided by the FCA.
- 5.Should you choose to invest through this website or with any of the international Ultima Markets entities, you will be subject to the rules and regulations of the relevant international regulatory authorities, not the FCA.
Ultima Markets wants to make it clear that we are duly licensed and authorised to offer the services and financial derivative products listed on our website. Individuals accessing this website and registering a trading account do so entirely of their own volition and without prior solicitation.
By confirming your decision to proceed with entering the website, you hereby affirm that this decision was solely initiated by you, and no solicitation has been made by any Ultima Markets entity.
I confirm my intention to proceed and enter this website Please direct me to the website operated by Ultima Markets , regulated by the FCA in the United KingdomThe doji is one of the most iconic candlestick patterns in technical analysis. It represents a subtle balance between buyers and sellers during a specific period and often serves as a signal of market indecision or potential reversal. In today’s financial markets, the doji remains an essential element of technical analysis.
This article incorporates the latest research from 2025 and explores practical techniques such as combining the doji with RSI and MACD signals, as well as using volume analysis to interpret trend direction. These insights are designed to help you apply the pattern effectively on the Ultima Markets platform and improve your trading accuracy.

What Is a Doji?
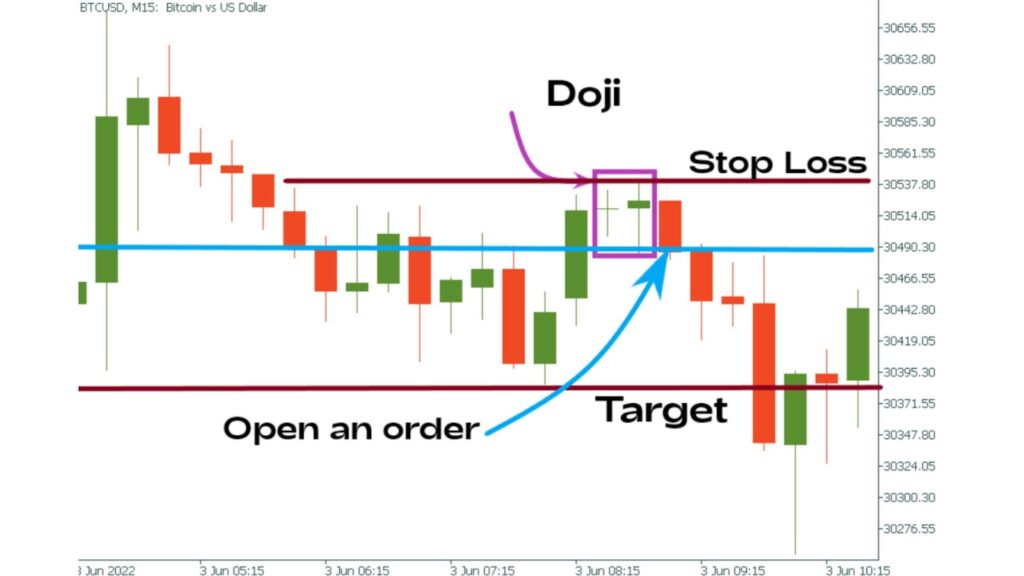
A doji is a candlestick pattern characterized by nearly identical open and close prices, resulting in a very small body that resembles a cross or near-cross shape. It often signifies a tug-of-war between bulls and bears, indicating indecision and the potential for a market reversal.
The meaning of a doji can vary depending on market context:
- If it appears at the end of a strong uptrend or downtrend, it may signal a potential reversal.
- If it forms during a consolidation period, it often implies that the market is still waiting for a breakout direction.
Its role goes beyond a simple stop signal—it’s a key indicator of market equilibrium.
Common Doji Patterns: Interpretation and Application

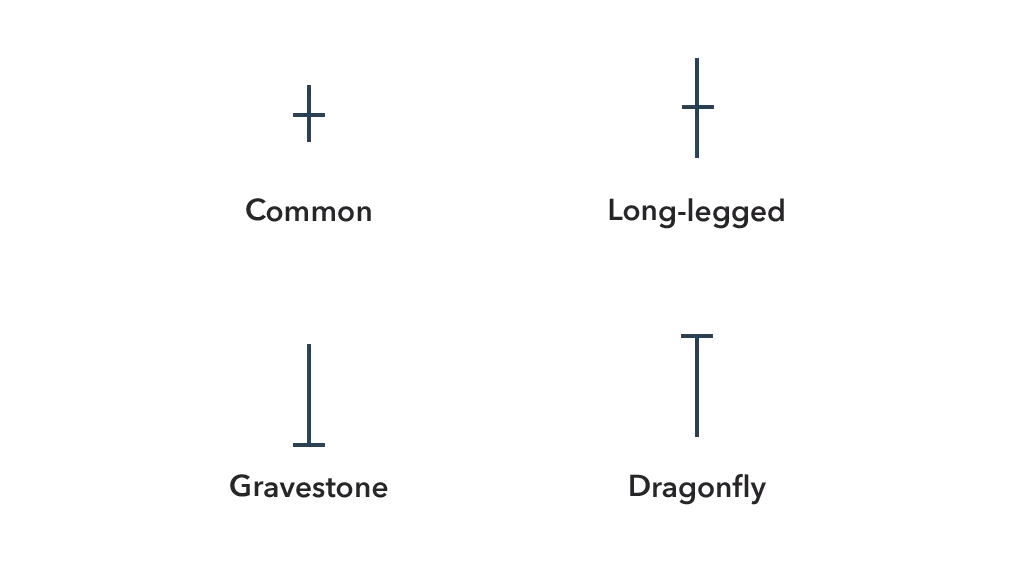
1. Standard Doji
This is the most typical doji pattern, featuring nearly equal upper and lower shadows and a tiny body. Commonly seen mid-trend, it reflects balanced buying and selling forces and signals hesitation in the market. When it occurs during a strong uptrend, it may suggest that buying pressure is weakening. If combined with support level analysis, it may also indicate a potential rebound.
2. Dragonfly Doji
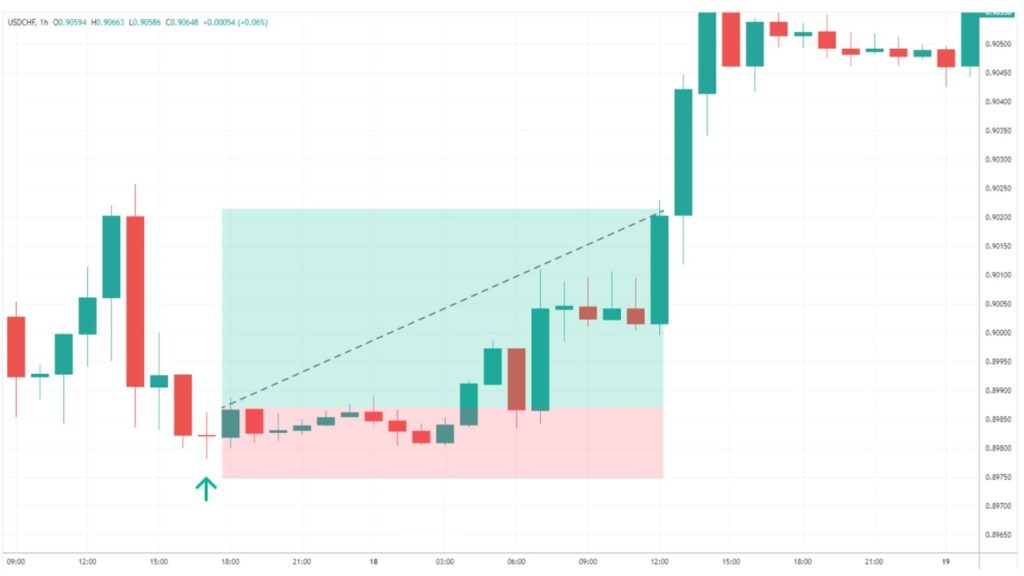
The dragonfly doji is marked by a long lower shadow and virtually no upper shadow. When it appears after a downtrend, it suggests buyer reentry. Although bears may have controlled the session initially, bulls managed to pull prices back, closing near the open. This pattern typically forms at the bottom of a downtrend and reflects weakening selling pressure and increasing buyer strength.
Dragonfly doji setups are particularly common in forex trading—especially at the end of a downtrend, where the long lower shadow shows strong bull reentry. Such formations frequently occur near support levels on pairs like EUR/USD and GBP/USD.
3. Gravestone Doji
Opposite to the dragonfly doji, the gravestone doji has a long upper shadow and a very short body, with little to no lower shadow. Appearing after an uptrend, it indicates a possible bearish reversal. Bulls pushed the price up during the session, but bears regained control by the close, suggesting a shift toward downward momentum.
For traders looking to enter short positions, this is a strong reversal signal.
4. Long-legged Doji
This type of doji features long upper and lower shadows, indicating significant intraday volatility but a close near the open. It reflects extreme market uncertainty and often appears before or after major economic events.
When the long-legged doji is properly combined with trend reversal analysis—such as filtering with MACD or Bollinger Bands—it can significantly reduce false signals.
How to Combine Doji with Technical Indicators for Trade Decisions
A single candlestick pattern is rarely a sufficient basis for trading decisions. Traders often combine the doji pattern with other technical tools to improve accuracy and win rates.

Doji + RSI for Entry and Exit Timing
If a doji appears in the RSI overbought or oversold zone, it often signals a stronger likelihood of a reversal. When combined with RSI crossover and MACD golden or death crosses, reversal predictions become more reliable.
Example: A dragonfly doji forming while EUR/USD is in the RSI oversold zone (<30) indicates a potential buy signal.
Moving Averages with Support/Resistance Confirmation
When a doji appears near long-term moving averages like MA60 or MA200, it becomes more significant. Especially in early trend reversal phases, it often coincides with MA convergence or breakout.
Example: If a doji intersects both the 50-day and 200-day moving averages, and is accompanied by rising volume, it often implies a higher chance of a trend shift.
Volume as Additional Confirmation
If a doji forms with increased trading volume, it reflects significant market movement. In contrast, a doji with low volume may simply indicate a consolidation.
To further refine the doji + RSI signal strategy, you can use Ultima Markets’ Trading Central tool to automatically detect candlestick patterns and indicator structures, greatly reducing the burden of manual analysis.
Doji Pattern Applications in the Forex Market

1. Forex Market
After a dragonfly doji appears on the EUR/USD daily chart, the average price increase is 0.8%. Using UM’s demo account to test strategies based on this signal can provide valuable practical feedback.
2. Stocks and Indices
The gravestone doji is frequently seen around earnings releases. When searching for daily chart dojis as signs of potential reversals, traders can analyze them with UM’s built-in charting tools.
3. Cryptocurrency Market
Due to high volatility, false breakouts from doji patterns are common in crypto trading. Therefore, strategies for applying doji in forex, stock, or crypto markets require multi-angle validation. Ultima Markets offers crypto trading access along with risk management tools, making it an ideal platform for real-world strategy application.
Executing the Doji Strategy on Ultima Markets: From Demo to Live Trading
Ultima Markets offers a complete trading environment, including MT4/MT5 chart analysis, Trading Central pattern alerts, and high leverage with built-in risk control. Doji-based reversal strategies on daily charts can be quickly marked with UM’s charting tools and tested in a demo account, enabling traders to complete the strategy design process within approximately 30 minutes.
Why Practice the Doji Strategy with a Trading Account at Ultima Markets?
The trading value of the doji lies in its ability to signal potential reversals or consolidations early. To apply such patterns effectively, real-time data, analytical tools, and execution efficiency are critical.
With a trading account at Ultima Markets, you will benefit from:
- A demo account with $100,000 virtual funds to test the doji candlestick pattern and various trading strategies;
- A high-performance trading platform: MT4, MT5, and UM’s proprietary app support real-time candlestick analysis with integrated Trading Central insights;
- Ultra-low trading costs: ECN accounts with spreads as low as 0.0 and a commission of $5 per lot for greater strategic flexibility;
- High leverage support: up to 1:2000 leverage for efficient capital utilization;
- Fund security and insurance: funds are held at Westpac Bank in Australia, with additional coverage of up to $1 million provided by globally recognized insurers.
If you are looking to refine your application of doji patterns with technical indicators in real trading scenarios, Ultima Markets is your ideal platform for strategy validation and real-world execution.
Conclusion
In the trading world, understanding market sentiment is key to success. The doji candlestick, a classic pattern, not only helps traders identify potential reversal points but also provides a calm, objective basis for decision-making during key moments of market indecision.
But remember, the doji is never a standalone signal. Only when interpreted alongside other indicators can it fully demonstrate its value. Whether you’re a beginner or an experienced trader, choosing a stable, transparent platform with comprehensive tools is the first step toward improving your success rate.
Ultima Markets helps you see the market’s future direction—starting from the fine details of the doji pattern.
Disclaimer: This content is provided for informational purposes only and does not constitute, and should not be construed as, financial, investment, or other professional advice. No statement or opinion contained here in should be considered a recommendation by Ultima Markets or the author regarding any specific investment product, strategy, or transaction. Readers are advised not to rely solely on this material when making investment decisions and should seek independent advice where appropriate.


