This website is managed by Ultima Markets’ international entities, and it’s important to emphasise that they are not subject to regulation by the FCA in the UK. Therefore, you must understand that you will not have the FCA’s protection when investing through this website – for example:
You will not be guaranteed Negative Balance Protection
You will not be protected by FCA’s leverage restrictions
You will not have the right to settle disputes via the Financial Ombudsman Service (FOS)
You will not be protected by Financial Services Compensation Scheme (FSCS)
Any monies deposited will not be afforded the protection required under the FCA Client Assets Sourcebook. The level of protection for your funds will be determined by the regulations of the relevant local regulator.
Note: UK clients are kindly invited to visit https://www.ultima-markets.co.uk/. Ultima Markets UK expects to begin onboarding UK clients in accordance with FCA regulatory requirements in 2026.
If you would like to proceed and visit this website, you acknowledge and confirm the following:
1.The website is owned by Ultima Markets’ international entities and not by Ultima Markets UK Ltd, which is regulated by the FCA.
2.Ultima Markets Limited, or any of the Ultima Markets international entities, are neither based in the UK nor licensed by the FCA.
3.You are accessing the website at your own initiative and have not been solicited by Ultima Markets Limited in any way.
4.Investing through this website does not grant you the protections provided by the FCA.
5.Should you choose to invest through this website or with any of the international Ultima Markets entities, you will be subject to the rules and regulations of the relevant international regulatory authorities, not the FCA.
Ultima Markets wants to make it clear that we are duly licensed and authorised to offer the services and financial derivative products listed on our website. Individuals accessing this website and registering a trading account do so entirely of their own volition and without prior solicitation.
By confirming your decision to proceed with entering the website, you hereby affirm that this decision was solely initiated by you, and no solicitation has been made by any Ultima Markets entity.
Demand and Supply Trading Explained: Forex Strategy Guide
Summary:
Learn how to trade using demand and supply zones in forex. Discover key formations, strategies, and indicator combinations for high-probability trades.
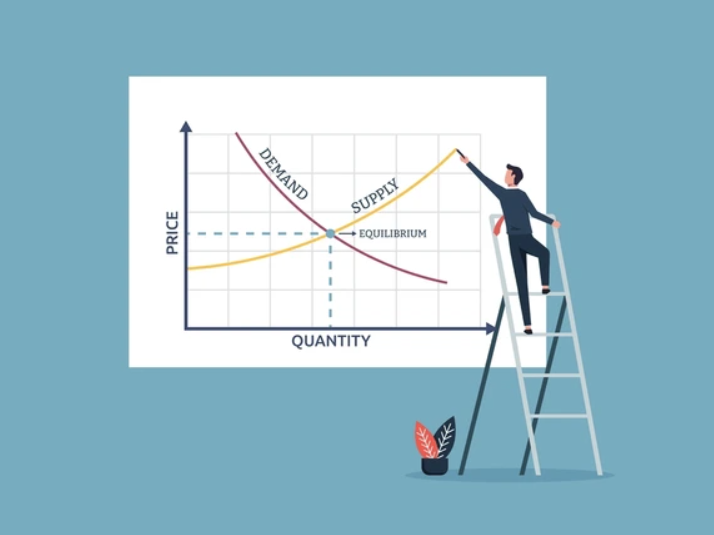
What is Demand and Supply Trading?
Demand and supply trading is a price-action method that identifies zones where purchase (demand) or selling (supply) pressure was formerly dominant, and assumes that when the price revisits those zones, similar reactions may occur. In simpler terms:
A demand zone is a price area where buyers previously stepped in aggressively, pushing prices upward.
A supply zone is a region where sellers overwhelmed buyers, driving prices downward.
These zones represent imbalances moments when supply is not equal to demand. Traders use them to anticipate reversals, continuations, or re-tests.
This approach is deeply rooted in microeconomic theory (supply & demand) but adapted to market structure and order-flow dynamics.
Why Demand & Supply Zones Matter (vs. Support & Resistance)
While support & resistance lines are popular, demand & supply zones offer several advantages:
Zones over lines: Zones accommodate real market behavior rather than assuming perfect precision.
Institutional footprint: These zones often reflect institutional activity and large order flow.
Imbalance detection: They capture areas of sharp price movement, indicating where imbalances occurred.
More robust signals: Because they reflect deeper market structure, they may prove more durable than simple S/R lines.
However, demand & supply trading is not magical, zones may break, shift, or become invalid with changing market structure. Always combine with confirmation and risk controls.
Core Principles & Market Psychology
To use demand and supply trading well, you must internalize several underlying concepts and market behaviors:
Imbalance & absorption: When price moves rapidly from a consolidation or base, it often leaves unfilled orders (imbalance). When price returns, those orders may “absorb” new attempts, causing reaction.
Liquidity zones: Supply/demand zones often overlap with liquidity areas (stop orders, pending orders) where institutional players execute.
Order flow & institutional moves: Large institutions rarely enter in the middle of a range; they often place orders around zones.
Market memory and reuse: Markets tend to revisit prior zones when conditions align that’s why past demand or supply zones matter.
Shifting zones: As price action evolves, zones can lose potency. A broken or inefficient zone should be retired or re-evaluated.
Understanding the psychology behind how orders accumulate, get triggered, or get wiped out helps you avoid false signals.
How to Identify Demand and Supply Zones
Spotting demand and supply zones accurately is the foundation of any price-action-based strategy. A zone that reflects true order imbalance where large buyers or sellers entered the market often leads to repeatable trade setups.
Start with Higher Time Frames
Always begin your analysis on higher-timeframe charts (daily, 4H, or weekly). Higher time frames filter out noise and highlight zones that attract institutional traders, the ones with enough volume to shift price direction.
On the daily chart, locate sharp moves (impulse candles) following a brief consolidation, these often mark the beginning of strong demand or supply areas.
Once marked, drop down to lower time frames (1H, 15M) to refine entries or look for confirmation patterns.
Look for the “Base–Impulse–Return” Structure
A valid demand or supply zone usually forms when the market moves in three stages:
Base: A short period of consolidation or sideways candles showing accumulation or distribution.
Impulse: A strong breakout candle with large range or volume — indicating institutional participation and order imbalance.
Return: When price revisits that base, it often reacts again, confirming the zone’s validity.
Example:
If the market consolidates near 1.1500, then rallies sharply to 1.1700 — the area between 1.1480 and 1.1520 becomes a demand zone.
Conversely, if the market drops sharply from 1.1700 after consolidation, that area becomes a supply zone.
Identify the Candle Origin and Zone Boundaries
To draw a precise zone:
Demand zone: From the lowest wick of the base candle up to the open of the first bullish impulse candle.
Supply zone: From the highest wick of the base candle down to the open of the first bearish impulse candle.
This range captures where buy or sell orders were likely concentrated before price exploded.
Confirm with Volume and Momentum
Volume spikes often confirm genuine order imbalance. When the breakout from the base occurs with increased volume or strong momentum (long candle bodies, little pullback), it signals large institutional activity.
Indicators that help:
Volume Profile / VWAP – shows where major trading activity took place.
RSI / MACD – divergence may hint at weakening zones.
ATR – identifies volatility shifts when zones are formed.
Filter Zones by Strength
Zone strength criteria may include:
The magnitude and speed of the impulse
Volume or momentum during the breakout
Time spent in the base, shorter is often better
Number of times price revisits or respects the zone
Discard Weak or Contaminated Zones
If price has sliced through a zone easily without reaction, or the zone is overlapped by too much noise, it’s less reliable. Keep your zone map clean.
Strategies to Trade Demand & Supply
In demand and supply trading, the goal is to trade where big players buy or sell at price zones showing strong imbalance. Here are the key strategies used by professional traders:
Re-Test (Bounce) Strategy
Wait for price to return to a demand or supply zone and show rejection such as a pin bar or engulfing candle.
Buy near demand, sell near supply.
Place stop loss just beyond the zone. The first retest of a fresh zone often gives the highest probability setup.
Breakout and Retest
When price breaks through a zone, it often flips its role:
Broken supply becomes new demand.
Broken demand becomes new supply. Wait for a clean retest and confirmation before entering with the trend.
Trade with the Trend
Align trades with the overall market direction.
In uptrends, focus on buying at demand zones.
In downtrends, sell at supply zones.
Trend-aligned setups usually provide smoother and safer entries.
Confirmation Entry
Instead of entering blindly, wait for signals like:
Candlestick patterns (pin bar, engulfing)
Volume spike or RSI divergence
This reduces false signals and filters weak zones.
Multi-Timeframe Confluence
Mark zones on higher timeframes (4H or daily) and refine entries on lower charts (15M or 1H). Combining multiple timeframes gives more precise entries with better risk-reward.
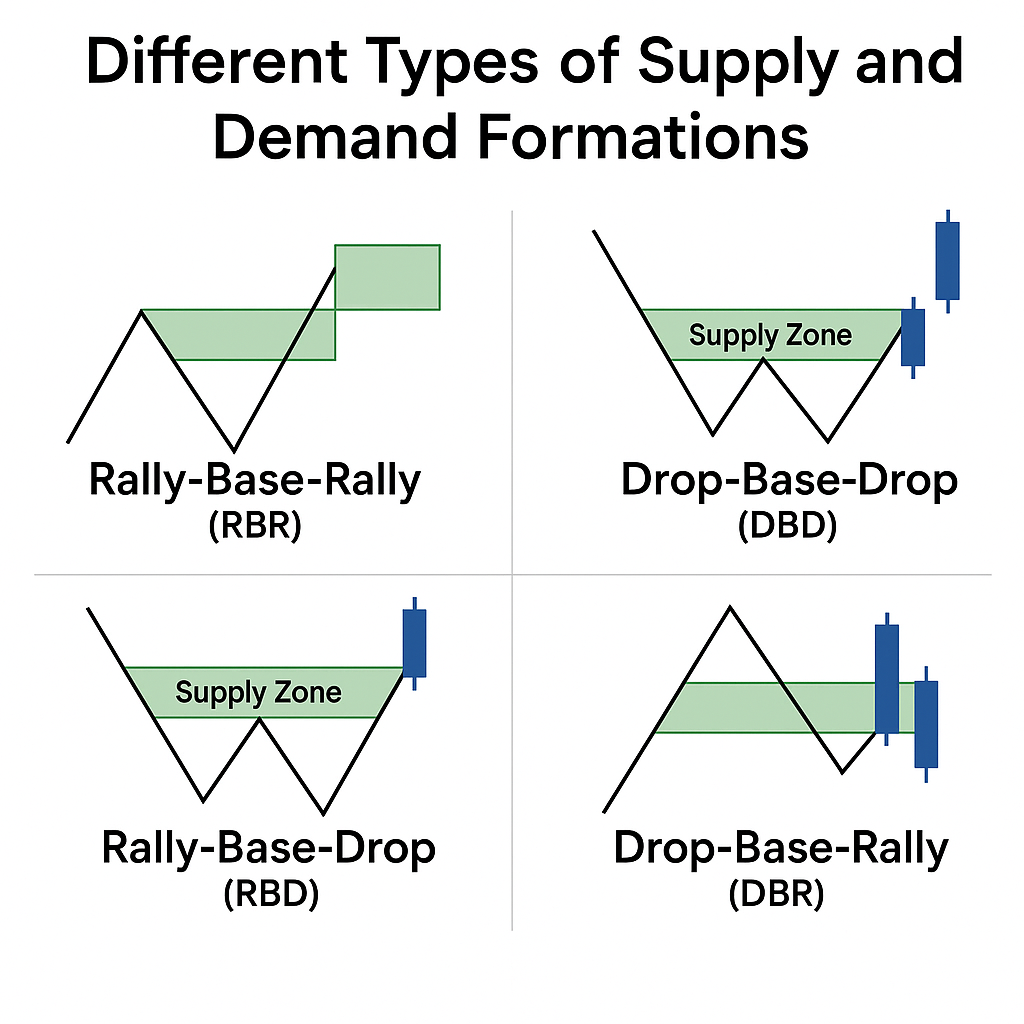
Different Types of Supply and Demand Formations
In demand and supply trading, price movements often form repeatable patterns that reflect how buyers and sellers interact. These formations help traders visualize market structure and identify potential reversal or continuation zones. The four key formations are:
Rally–Base–Rally (RBR)
A bullish continuation pattern. Price rallies, pauses briefly (the base), then rallies again. The base represents temporary consolidation before more buying pressure. Traders mark the base as a demand zone for potential buy entries when price revisits it.
Drop–Base–Drop (DBD)
A bearish continuation pattern. Price drops, forms a small base, and continues dropping. The base becomes a supply zone, showing where sellers paused before resuming control. Traders watch for retests to enter short positions.
Rally–Base–Drop (RBD)
A bearish reversal pattern. Price rallies into a base, stalls, and then drops sharply. The base marks a strong supply zone, where buyers were absorbed and sellers took over. Often signals the start of a new downtrend.
Drop–Base–Rally (DBR)
A bullish reversal pattern. Price drops into a base, consolidates, and then rallies upward. The base becomes a demand zone, showing where selling pressure ended and buyers regained control. Common near market bottoms or after large corrections.
Recognizing these RBR, DBD, RBD, and DBR formations helps forex traders anticipate future price reactions more accurately. Each structure reveals the balance between supply and demand, giving traders insight into where high-probability entries and exits lie.
How to Use Supply and Demand Zones with Other Indicators
While demand and supply zones are powerful on their own, combining them with other technical indicators can significantly improve accuracy and timing. Indicators help confirm market direction, identify momentum shifts, and filter false signals.
Moving Averages: Use moving averages (MA, EMA, or SMA) to confirm trend direction. In an uptrend, focus on demand zones below the MA for buy entries. In a downtrend, trade supply zones above the MA for short setups.
RSI (Relative Strength Index): RSI helps detect overbought or oversold conditions near your zones. When price approaches a demand zone and RSI shows oversold (<30), it supports a potential bounce. When price nears a supply zone and RSI is overbought (>70), it confirms likely resistance.
Volume Indicators: Volume reveals how strongly the market reacts to zones. A spike in volume when price touches a demand zone suggests active buying. Weak volume at a supply zone may hint that sellers are losing control.
MACD (Moving Average Convergence Divergence): MACD confirms momentum direction and potential reversals. A bullish crossover near a demand zone supports long entries. A bearish crossover near a supply zone reinforces short trades.
Fibonacci Retracement: Fibonacci levels often align with existing demand or supply zones. Zones that overlap with key retracement levels (38.2%, 50%, 61.8%) are considered stronger. This confluence helps validate entry points and improve confidence.
Conclusion
Demand and supply trading gives forex traders a clear edge by focusing on where real market imbalances occur, areas where institutions buy or sell in volume. Unlike indicator-based systems, this price-action approach helps identify high-probability zones, reduce noise, and improve timing across currency pairs.
In forex trading, demand and supply zones act as the market’s “footprints,” showing where liquidity builds and reactions repeat. By combining these zones with confirmation tools, trend direction, and sound risk management, traders can make more confident and consistent decisions.
Mastering demand and supply trading takes patience, but once understood, it becomes one of the most reliable frameworks for reading the forex market.
Share Now
Disclaimer:This content is provided for informational purposes only and does not constitute, and should not be construed as, financial, investment, or other professional advice. No statement or opinion contained herein should be considered a recommendation by Ultima Markets or the author regarding any specific investment product, strategy, or transaction. Readers are advised not to rely solely on this material when making investment decisions and should seek independent advice where appropriate.
Thank you for visiting the Ultima Markets website. Please note that this website is intended for individuals residing in jurisdictions where access is permitted by law. Ultima and its affiliated entities do not operate in your home jurisdiction.
By clicking ‘Acknowledge’, you confirm that you are entering this website solely on your own initiative and not as a result of any specific marketing outreach. You wish to obtain information from this website based on reverse solicitation principles, in accordance with the applicable laws of your home jurisdiction.