
Ultima Markets App
Trade Anytime, Anywhere
Important Information
This website is managed by Ultima Markets’ international entities, and it’s important to emphasise that they are not subject to regulation by the FCA in the UK. Therefore, you must understand that you will not have the FCA’s protection when investing through this website – for example:
- You will not be guaranteed Negative Balance Protection
- You will not be protected by FCA’s leverage restrictions
- You will not have the right to settle disputes via the Financial Ombudsman Service (FOS)
- You will not be protected by Financial Services Compensation Scheme (FSCS)
- Any monies deposited will not be afforded the protection required under the FCA Client Assets Sourcebook. The level of protection for your funds will be determined by the regulations of the relevant local regulator.
Note: Ultima Markets is currently developing a dedicated website for UK clients and expects to onboard UK clients under FCA regulations in 2026.
If you would like to proceed and visit this website, you acknowledge and confirm the following:
- 1.The website is owned by Ultima Markets’ international entities and not by Ultima Markets UK Ltd, which is regulated by the FCA.
- 2.Ultima Markets Limited, or any of the Ultima Markets international entities, are neither based in the UK nor licensed by the FCA.
- 3.You are accessing the website at your own initiative and have not been solicited by Ultima Markets Limited in any way.
- 4.Investing through this website does not grant you the protections provided by the FCA.
- 5.Should you choose to invest through this website or with any of the international Ultima Markets entities, you will be subject to the rules and regulations of the relevant international regulatory authorities, not the FCA.
Ultima Markets wants to make it clear that we are duly licensed and authorised to offer the services and financial derivative products listed on our website. Individuals accessing this website and registering a trading account do so entirely of their own volition and without prior solicitation.
By confirming your decision to proceed with entering the website, you hereby affirm that this decision was solely initiated by you, and no solicitation has been made by any Ultima Markets entity.
I confirm my intention to proceed and enter this website Please direct me to the website operated by Ultima Markets , regulated by the FCA in the United Kingdom

What Is the Debt to Equity Ratio?
The debt to equity ratio (D/E) is a key financial leverage metric that compares a company’s total debt with its shareholders’ equity. In simple terms, it shows how much a company relies on borrowed money versus funds invested by its owners.
A high D/E suggests the company is heavily financed through debt, which may increase risk if earnings fall. A low D/E indicates a more conservative structure, with less reliance on borrowing.
Investors, creditors, and analysts use this ratio to assess financial stability, solvency, and risk before making investment or lending decisions.
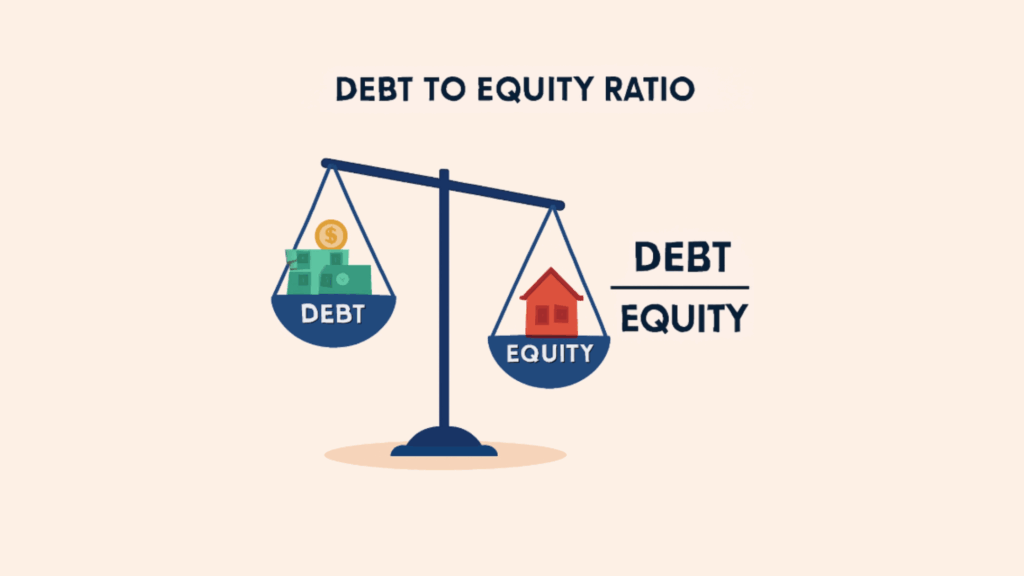
Debt to Equity Ratio Formula
The standard formula is:
Debt to Equity Ratio = Total Debt ÷ Total Shareholders’ Equity
- Total Debt: Short-term and long-term interest-bearing liabilities.
- Shareholders’ Equity: The net assets owned by shareholders (assets minus liabilities).
Some analysts use variations, such as long-term debt only or net debt (debt minus cash), depending on context. Always check which version is being used.
To calculate DE ratio, you will need to look at company’s quarterly/annual balance sheet. Then, add together short-term and long-term debt. Find total shareholders’ equity. Divide debt by equity. This gives you the D/E ratio.
What Is a Good Debt to Equity Ratio?
A good debt to equity ratio is typically between 1.0 and 2.0, depending on the industry. Ratios below 1.0 suggest conservative, low-risk financing, while ratios above 2.0 indicate higher leverage and greater financial risk unless supported by stable cash flows.
- Capital-intensive sectors (utilities, telecom, infrastructure): D/E above 2.0 is common and often acceptable.
- Asset-light sectors (software, semiconductors): D/E below 0.5 is typical.
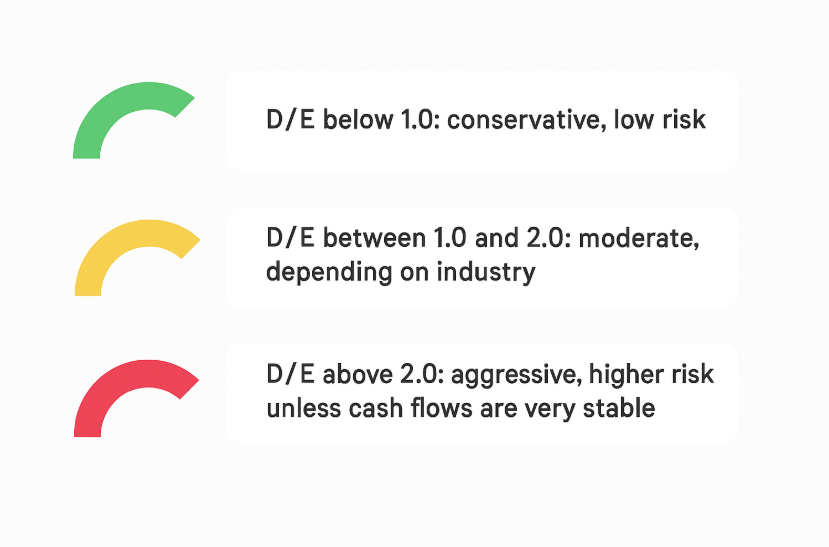
General rule of thumb:
- D/E below 1.0: conservative, low risk
- D/E between 1.0 and 2.0: moderate, depending on industry
- D/E above 2.0: aggressive, higher risk unless cash flows are very stable
Debt to Equity Ratio Examples
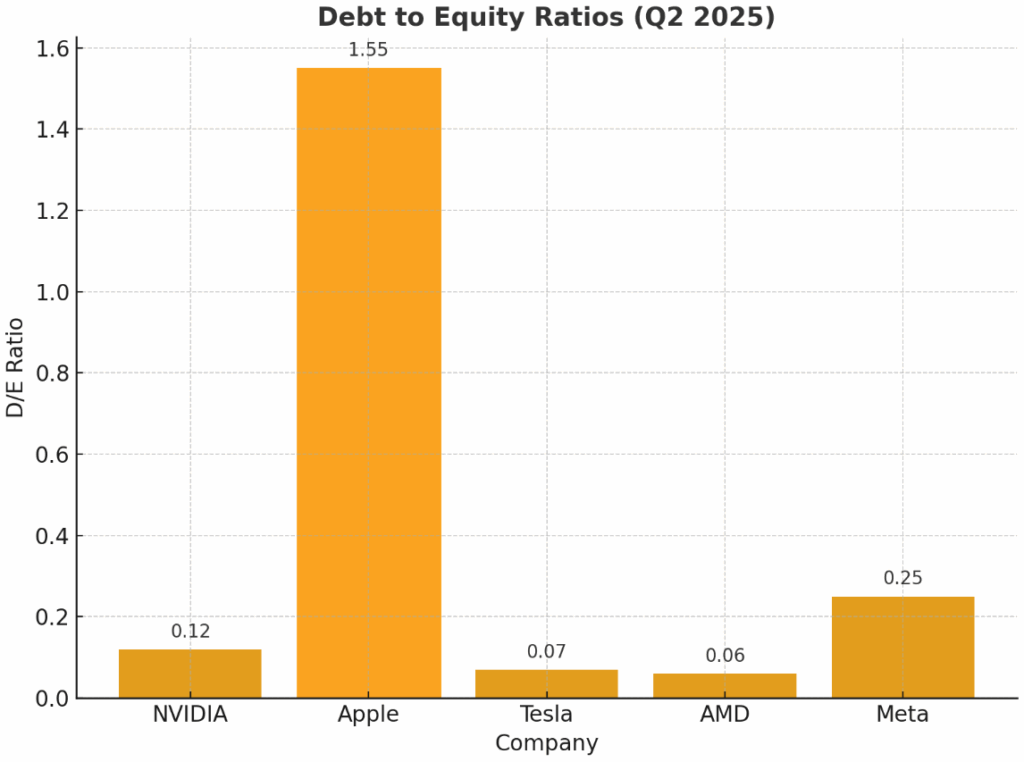
Here are the most recent 2025 debt to equity ratios for leading tech companies:
| Company | Total Debt (USD) | Total Equity (USD) | D/E Ratio | Interpretation |
| NVIDIA (NVDA) | ~10.3B | ~83.8B | 0.12 | Very low leverage. NVIDIA funds growth primarily through equity and strong cash flows. |
| Apple (AAPL) | ~98.2B | ~66.8B | 1.47–1.55 | Higher leverage vs peers. Apple strategically uses debt for buybacks and dividends. |
| Tesla (TSLA) | ~6B | ~85B | 0.07 | Minimal leverage. Tesla has strengthened its balance sheet through deleveraging. |
| AMD (AMD) | ~4.7B | ~57.9B | 0.06 | Extremely conservative. AMD maintains strong solvency and low financial risk. |
| Meta (META) | ~49.6B | ~195.1B | 0.25 | Low leverage. Meta balances debt with a large equity cushion. |
This table compares five leading technology companies and highlights how differently they use debt in their capital structures:
- NVIDIA (0.12) – NVIDIA carries almost no debt compared to its equity base. This means the company finances growth mainly through retained earnings and cash flows, minimizing financial risk.
- Apple (1.47–1.55) – Apple stands out as the most leveraged among these firms. While its debt-to-equity ratio looks high, Apple has stable, predictable cash flows and uses cheap debt strategically to fund share buybacks and dividends, boosting returns to shareholders.
- Tesla (0.07) – Tesla’s low ratio shows its successful effort to deleverage after years of expansion. Today, Tesla maintains a very strong equity position, reducing refinancing risk.
- AMD (0.06) – AMD is even more conservative, keeping debt levels minimal. This strategy reduces risk in volatile semiconductor markets and gives AMD flexibility during downturns.
- Meta (0.25) – Meta balances modest debt with strong equity reserves. Its ratio suggests a cautious approach, it uses some leverage but maintains plenty of financial flexibility.
Good Debt to Equity Ratio
- Below 1.0: Conservative and low risk; typical in asset-light industries like tech.
- 1.0–2.0: Moderate leverage; acceptable in many industries.
- Above 2.0: High risk unless supported by stable cash flows (common in utilities, telecoms, and infrastructure).
For tech companies, ratios under 0.5 are often considered “good,” showing strong solvency and flexibility.
Among these companies, Apple is the only one with a relatively high D/E ratio, but it’s strategic and sustainable due to its earnings strength. The rest like NVIDIA, Tesla, AMD, and Meta keep leverage very low, reflecting the broader trend in the tech industry to favor conservative financing.
Why D/E Ratio Matters
- Low D/E Benefits: Stability, resilience in downturns, higher investor confidence.
- High D/E Benefits (if managed well): Tax advantages, higher return on equity, and funding for aggressive growth.
- Risks of High D/E: Interest burden, refinancing risk, and lower flexibility in recessions.
Benefits of Low vs High Debt to Equity Ratios
The debt to equity ratio is more than just a number. It reveals how a company balances growth opportunities with financial risk. A low D/E ratio signals stability, lower reliance on borrowing, and greater resilience during downturns.
On the other hand, a high D/E ratio can indicate aggressive financing that may boost returns when times are good but increases vulnerability when conditions tighten. Understanding the benefits of both low and high D/E ratios helps investors evaluate whether a company’s capital structure is conservative, balanced, or risky.
Benefits of a Low D/E Ratio
- Greater resilience in downturns
- Lower interest costs and refinancing risk
- More financial flexibility for future borrowing
- Often associated with higher investor confidence
Benefits of a High D/E Ratio (if managed well)
- Can amplify return on equity (ROE) when borrowing costs are low
- Tax benefits from interest deductibility
- Provides capital for expansion without issuing more shares
Risks of a High D/E Ratio
- Higher vulnerability to interest rate increases
- Greater risk of default if earnings fall
- Debt covenants may restrict business flexibility
Industry Benchmarks Matter
When evaluating the debt to equity ratio, it’s important not to judge the number in isolation. Each industry operates with its own capital structure norms.
For example, technology and software companies typically maintain very low D/E ratios, often below 0.5, because they are asset-light and generate strong cash flows.
By contrast, utilities, telecoms, and infrastructure firms often run with much higher ratios, sometimes above 2.0, as their businesses are capital-intensive and supported by stable revenues. This is why a ratio of 1.5 might be considered aggressive for a tech stock like NVIDIA but perfectly acceptable for a regulated utility company. Comparing a company’s D/E ratio to its industry benchmark and peer group ensures a fairer, more accurate assessment of financial risk.
Conclusion
The debt to equity ratio is a simple yet powerful measure of a company’s financial health. Low ratios, as seen in NVIDIA, Tesla, and AMD, highlight strong solvency and stability, while higher ratios, like Apple’s, show how strategic use of debt can amplify returns.
At Ultima Markets, we believe informed trading starts with understanding these fundamentals. By analyzing metrics such as D/E ratios, you gain deeper insights into a company’s capital structure, resilience, and growth strategy. Whether you’re evaluating tech giants or capital-intensive industries, staying aware of leverage helps you trade with confidence.
Disclaimer: This content is provided for informational purposes only and does not constitute, and should not be construed as, financial, investment, or other professional advice. No statement or opinion contained here in should be considered a recommendation by Ultima Markets or the author regarding any specific investment product, strategy, or transaction. Readers are advised not to rely solely on this material when making investment decisions and should seek independent advice where appropriate.
Latest Articles


FOLLOW US


Ultima Markets is a member of The Financial Commission, an international independent body responsible for resolving disputes in the Forex and CFD markets.
All clients of Ultima Markets are protected under insurance coverage provided by Willis Towers Watson (WTW), a global insurance brokerage established in 1828, with claims eligibility up to US$1,000,000 per account.
Ultima Markets is the first United CFD broker to be part of the United Nations Global Compact.
FOLLOW US
TRADE WITH US
RISK DISCLOSURE
Risk Warning:
Trading leveraged financial products, including Contracts for Difference (CFDs), carries a high level of risk and may result in losses exceeding your initial investment. These products are not suitable for all investors and should only be traded with funds you can afford to lose. You do not own or have any rights to the underlying assets of these derivatives (e.g., entitlement to dividends). Please ensure you fully understand the associated risks. Before trading, consider your level of experience, investment objectives, and seek independent financial advice if necessary. Refer to our legal documents and disclosures before making any trading decisions.
General Advice Warning:
The information provided on this website is general in nature and does not take into account your personal objectives, financial situation, or needs. Before acting on any advice, you should assess its appropriateness in light of your individual circumstances and consult our legal documentation.
Regional Restrictions:
The information and services on this website are not intended for residents of certain jurisdictions, including but not limited to the United States, United Kingdom, Singapore, and any jurisdictions subject to international sanctions. For further information, please contact our customer support team.
Regulatory Information:
Ultima Markets is a trading name shared amongst multiple entities operating in various jurisdictions. These following entities are authorised to operate under the Ultima Markets brand and trademarks.
-
Ultima Markets UK Limited, reference number 470325, is authorised and regulated by the Financial Conduct Authority (FCA). Registered address: 1 Blossom Yard, Fourth Floor, London, E1 6RS, UNITED KINGDOM.
-
Ultima Markets Ltd is authorised and regulated by the Financial Services Commission (FSC) of Mauritius as a Full-Service Investment Dealer (excluding Underwriting), under licence number GB 23201593.
Registered address: 2nd Floor, The Catalyst, 40 Silicon Avenue, Ebene Cybercity, 72201, Mauritius.
Copyright © 2026 Ultima Markets Ltd. All rights reserved.
-

Messenger


Continue on Messenger
Take the conversation to your Messenger account. You can return anytime.
Scan the QR code and then send the message that appears in your Messenger.
Open Messenger on this device.
-

Instagram

Continue on Instagram
Take the conversation to your Instagram account. You can return anytime.
Scan the QR code to open Instagram. Follow @ultima_markets to send a DM.
Open Instagram on this device.
-

Live Chat
-
