
Ultima Markets App
Trade Anytime, Anywhere
Important Information
This website is managed by Ultima Markets’ international entities, and it’s important to emphasise that they are not subject to regulation by the FCA in the UK. Therefore, you must understand that you will not have the FCA’s protection when investing through this website – for example:
- You will not be guaranteed Negative Balance Protection
- You will not be protected by FCA’s leverage restrictions
- You will not have the right to settle disputes via the Financial Ombudsman Service (FOS)
- You will not be protected by Financial Services Compensation Scheme (FSCS)
- Any monies deposited will not be afforded the protection required under the FCA Client Assets Sourcebook. The level of protection for your funds will be determined by the regulations of the relevant local regulator.
Note: Ultima Markets is currently developing a dedicated website for UK clients and expects to onboard UK clients under FCA regulations in 2026.
If you would like to proceed and visit this website, you acknowledge and confirm the following:
- 1.The website is owned by Ultima Markets’ international entities and not by Ultima Markets UK Ltd, which is regulated by the FCA.
- 2.Ultima Markets Limited, or any of the Ultima Markets international entities, are neither based in the UK nor licensed by the FCA.
- 3.You are accessing the website at your own initiative and have not been solicited by Ultima Markets Limited in any way.
- 4.Investing through this website does not grant you the protections provided by the FCA.
- 5.Should you choose to invest through this website or with any of the international Ultima Markets entities, you will be subject to the rules and regulations of the relevant international regulatory authorities, not the FCA.
Ultima Markets wants to make it clear that we are duly licensed and authorised to offer the services and financial derivative products listed on our website. Individuals accessing this website and registering a trading account do so entirely of their own volition and without prior solicitation.
By confirming your decision to proceed with entering the website, you hereby affirm that this decision was solely initiated by you, and no solicitation has been made by any Ultima Markets entity.
I confirm my intention to proceed and enter this website Please direct me to the website operated by Ultima Markets , regulated by the FCA in the United Kingdom

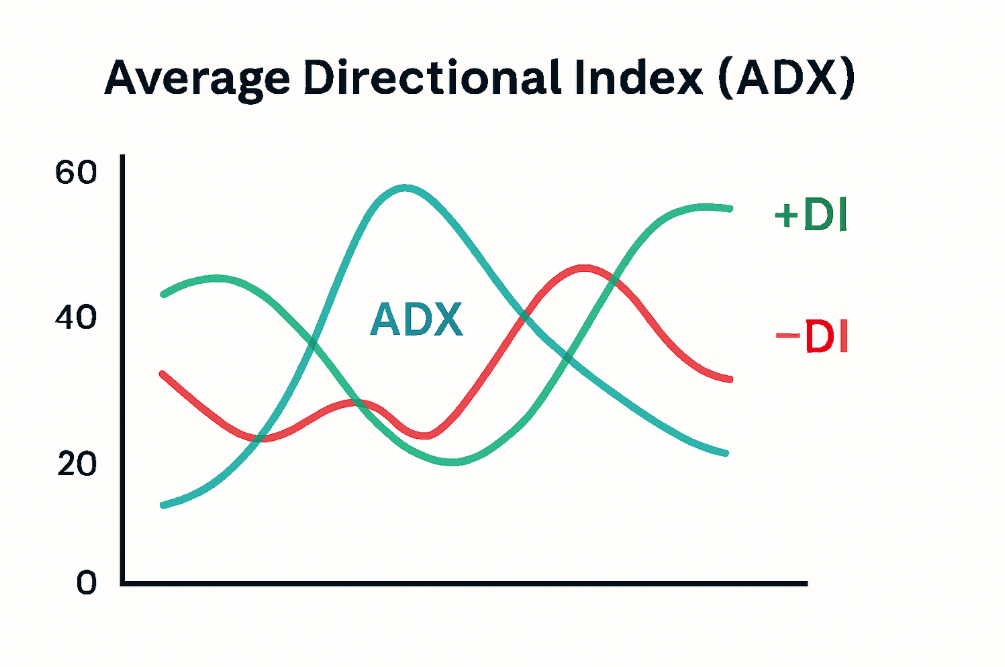
What is the Average Directional Index
The Average Directional Index ADX is a technical indicator that measures trend strength from 0 to 100, not direction. It is computed from the smoothed relationship between +DI and −DI using Wilder smoothing. Traders typically view below 20 as weak, 25 or higher as trending, and use a rising ADX to confirm breakouts and filter signals.
Why traders use ADX
- Quickly classify market regime trend or range
- Confirm breakouts as ADX rises from low levels
- Filter entries signalled by +DI and −DI
- Manage expectations for holding winners longer in strong trends
Formula Explained
Default lookback: 14 periods. Wilder’s smoothing is used in most platforms.
- True Range TR for each bar
- Directional Movement
+DM = current high − previous high if it is greater than previous low − current low and positive, else 0
−DM = previous low − current low if it is greater than current high − previous high and positive, else 0 - Smooth with Wilder’s method to get ATR_n, +DM_n, −DM_n
- Directional Indicators
+DI_n = 100 × (+DM_n ÷ ATR_n)
−DI_n = 100 × (−DM_n ÷ ATR_n) - Directional Movement Index, DX = 100 × |(+DI_n − −DI_n)| ÷ (+DI_n + −DI_n)
- Average Directional Index
First ADX is the average of the first n DX values
Subsequent ADX values use Wilder smoothing:
ADX_t = [(ADX_{t−1} × (n−1)) + DX_t] ÷ n
Give the indicator enough warm-up bars so early values stabilise. Minor differences between platforms come from how they seed the first smoothed values or whether they use EMA approximations
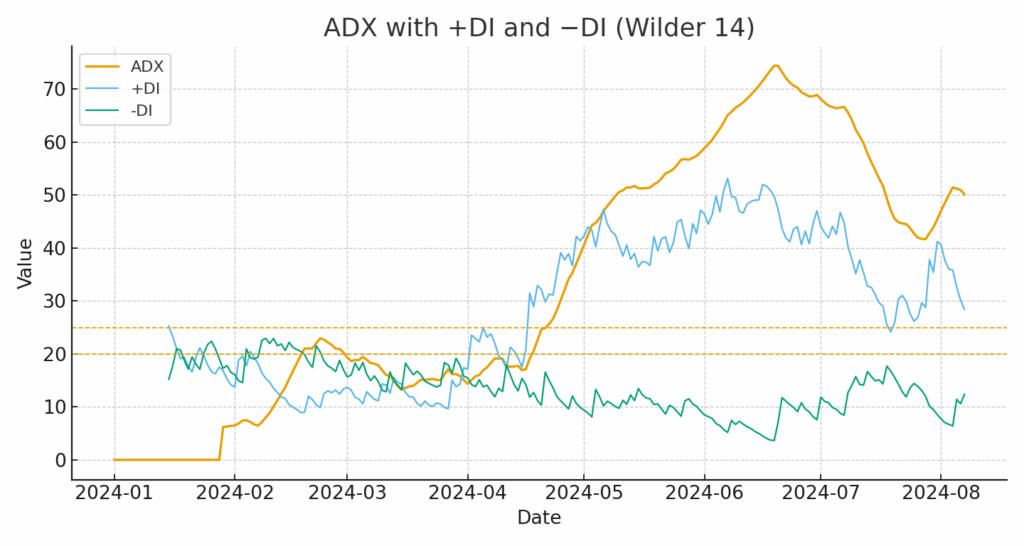
How to Read ADX Values
ADX reads trend strength on a 0–100 scale. 0–20 usually means range or weak trend, 20–25 a trend may be forming, 25–50 a confirmed trend, 50–75 a very strong trend with potential late-stage risk, and 75–100 rare extremes. Use +DI vs −DI or price action to determine direction while ADX rises to confirm momentum.
- 0–20 weak or range
- 20–25 trend may be forming
- 25–50 confirmed trend
- 50–75 very strong trend
- 75–100 rare extremes
Use +DI vs −DI for direction and look for rising ADX to confirm momentum.
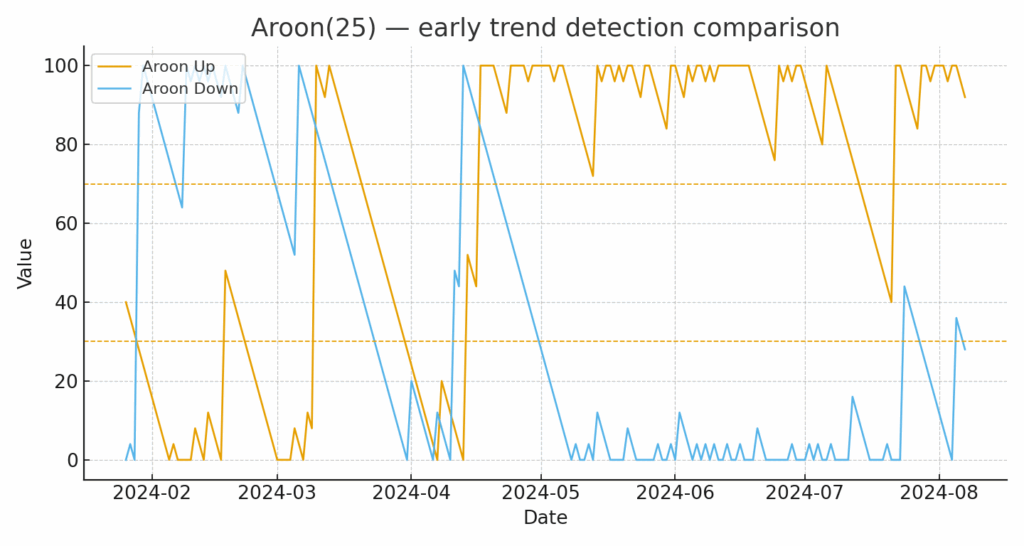
ADX vs The Aroon Indicator
Aroon is based on time since the most recent high or low within a lookback window. Aroon Up close to 100 means a recent high was made. Aroon Down close to 100 means a recent low was made. The Aroon Oscillator Aroon Up minus Aroon Down tracks who is in control.
How they differ
| Aspect | ADX | Aroon |
| Core idea | Strength of directional range expansion | Time since latest high or low |
| Direction | Direction-agnostic strength via +DI and −DI | Direction from Up and Down lines |
| Speed | Smoother and later by design | Often earlier on new trends |
| Best use | Confirming trend quality and persistence | Flagging emerging trends and range shifts |
| Typical default | 14 | 25 |
Use Aroon to alert you to potential new trends and ADX to confirm that the move has real strength before committing capital or sizing up.
Setups that Experienced Traders Actually Use
Before you trade, use ADX to decide if the market favours trends or ranges. The setups below show how experienced traders pair ADX with +DI and −DI, structure, and risk controls to enter, add, and exit with discipline.
DI crossover with ADX confirmation
- Entry long when +DI crosses above −DI and ADX is rising above 20 to 25
- Entry short when −DI crosses above +DI with ADX rising
- Exit with an ATR trailing stop or on ADX rolling over from a lower high
Breakout validation
During consolidations, watch for ADX rising from sub 15 to above 20 as price breaks a range. This improves the odds of continuation and helps avoid many false breakouts.
Trend add-on rules
For multi-unit positions, add only when ADX continues to rise and price holds structure higher highs in uptrends or lower lows in downtrends.
Mean-reversion filter
Skip counter-trend trades when ADX is above 25. Mean-reversion edges typically work better when ADX is low.
Parameter Tuning and Variants
Lookback choices
- 7 to 10 faster, more noise, earlier signals
- 14 balanced default
- 20 to 30 slower, fewer whipsaws, more lag
ADXR variant
Some platforms offer ADXR, the average of today’s ADX and the ADX from n periods ago. It stabilises readings further at the cost of extra lag.
Instrument and timeframe calibration
- Forex majors often trend well on higher timeframes. Many traders use ADX 20 to 25 as a trend filter on H4 or daily.
- Equities with frequent gaps may require longer lookbacks.
- Crypto can benefit from shorter lookbacks during high volatility but confirm with structure or volume.
Common Mistakes to Avoid
- Confusing strength with direction Remember ADX does not tell you up or down. Use +DI and −DI, price action, or another directional tool.
- Over-optimising Chasing the perfect period for a recent backtest rarely generalises. Keep settings simple.
- Ignoring regime shifts Thresholds that work on one market or timeframe may not fit another. Review and recalibrate.
- Trading every DI crossover Use ADX slope and market structure to filter low-quality signals.
Conclusion
The Average Directional Index helps you answer one question with discipline, and is the market trending strongly enough to justify a trend approach. Use ADX alongside +DI and −DI, clear levels, and risk controls. If you want a clean place to practise, Ultima Markets offers fast execution, a wide range of instruments, and education through UM Academy so you can test ADX rules on a demo before committing real capital. Trade thoughtfully, review your journal, and let data guide your next step with Ultima Markets.
Disclaimer: This content is provided for informational purposes only and does not constitute, and should not be construed as, financial, investment, or other professional advice. No statement or opinion contained here in should be considered a recommendation by Ultima Markets or the author regarding any specific investment product, strategy, or transaction. Readers are advised not to rely solely on this material when making investment decisions and should seek independent advice where appropriate.
Latest Articles


FOLLOW US


Ultima Markets is a member of The Financial Commission, an international independent body responsible for resolving disputes in the Forex and CFD markets.
All clients of Ultima Markets are protected under insurance coverage provided by Willis Towers Watson (WTW), a global insurance brokerage established in 1828, with claims eligibility up to US$1,000,000 per account.
Ultima Markets is the first United CFD broker to be part of the United Nations Global Compact.
FOLLOW US
TRADE WITH US
RISK DISCLOSURE
Risk Warning:
Trading leveraged financial products, including Contracts for Difference (CFDs), carries a high level of risk and may result in losses exceeding your initial investment. These products are not suitable for all investors and should only be traded with funds you can afford to lose. You do not own or have any rights to the underlying assets of these derivatives (e.g., entitlement to dividends). Please ensure you fully understand the associated risks. Before trading, consider your level of experience, investment objectives, and seek independent financial advice if necessary. Refer to our legal documents and disclosures before making any trading decisions.
General Advice Warning:
The information provided on this website is general in nature and does not take into account your personal objectives, financial situation, or needs. Before acting on any advice, you should assess its appropriateness in light of your individual circumstances and consult our legal documentation.
Regional Restrictions:
The information and services on this website are not intended for residents of certain jurisdictions, including but not limited to the United States, United Kingdom, Singapore, and any jurisdictions subject to international sanctions. For further information, please contact our customer support team.
Regulatory Information:
Ultima Markets is a trading name shared amongst multiple entities operating in various jurisdictions. These following entities are authorised to operate under the Ultima Markets brand and trademarks.
-
Ultima Markets UK Limited, reference number 470325, is authorised and regulated by the Financial Conduct Authority (FCA). Registered address: 1 Blossom Yard, Fourth Floor, London, E1 6RS, UNITED KINGDOM.
-
Ultima Markets Ltd is authorised and regulated by the Financial Services Commission (FSC) of Mauritius as a Full-Service Investment Dealer (excluding Underwriting), under licence number GB 23201593.
Registered address: 2nd Floor, The Catalyst, 40 Silicon Avenue, Ebene Cybercity, 72201, Mauritius.
Copyright © 2026 Ultima Markets Ltd. All rights reserved.
-

Messenger


Continue on Messenger
Take the conversation to your Messenger account. You can return anytime.
Scan the QR code and then send the message that appears in your Messenger.
Open Messenger on this device.
-

Instagram

Continue on Instagram
Take the conversation to your Instagram account. You can return anytime.
Scan the QR code to open Instagram. Follow @ultima_markets to send a DM.
Open Instagram on this device.
-

Live Chat
-
