This website is managed by Ultima Markets’ international entities, and it’s important to emphasise that they are not subject to regulation by the FCA in the UK. Therefore, you must understand that you will not have the FCA’s protection when investing through this website – for example:
You will not be guaranteed Negative Balance Protection
You will not be protected by FCA’s leverage restrictions
You will not have the right to settle disputes via the Financial Ombudsman Service (FOS)
You will not be protected by Financial Services Compensation Scheme (FSCS)
Any monies deposited will not be afforded the protection required under the FCA Client Assets Sourcebook. The level of protection for your funds will be determined by the regulations of the relevant local regulator.
Note: UK clients are kindly invited to visit https://www.ultima-markets.co.uk/. Ultima Markets UK expects to begin onboarding UK clients in accordance with FCA regulatory requirements in 2026.
If you would like to proceed and visit this website, you acknowledge and confirm the following:
1.The website is owned by Ultima Markets’ international entities and not by Ultima Markets UK Ltd, which is regulated by the FCA.
2.Ultima Markets Limited, or any of the Ultima Markets international entities, are neither based in the UK nor licensed by the FCA.
3.You are accessing the website at your own initiative and have not been solicited by Ultima Markets Limited in any way.
4.Investing through this website does not grant you the protections provided by the FCA.
5.Should you choose to invest through this website or with any of the international Ultima Markets entities, you will be subject to the rules and regulations of the relevant international regulatory authorities, not the FCA.
Ultima Markets wants to make it clear that we are duly licensed and authorised to offer the services and financial derivative products listed on our website. Individuals accessing this website and registering a trading account do so entirely of their own volition and without prior solicitation.
By confirming your decision to proceed with entering the website, you hereby affirm that this decision was solely initiated by you, and no solicitation has been made by any Ultima Markets entity.
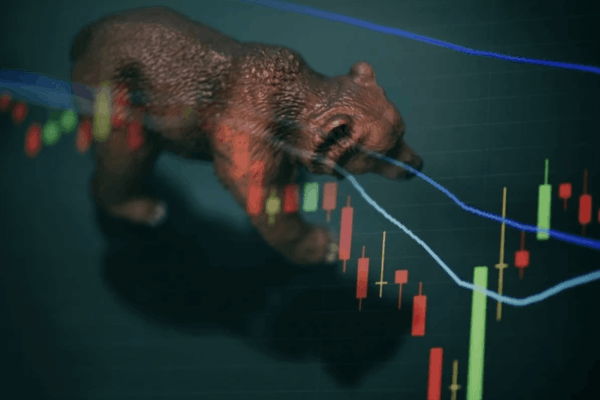
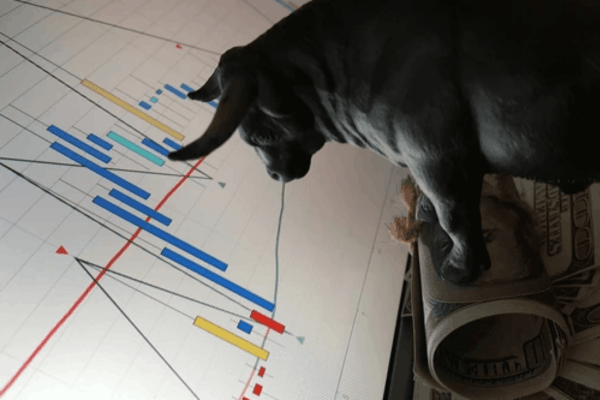
Are we in a bull or bear market now in 2026? Explore the latest data, market trends, and key indicators to understand where stocks are heading currently.
Are We in a Bull or Bear Market Now
If you have been watching your portfolio swing and asking yourself are we in a bull or bear market, you are not alone.
The S&P 500 climbed to an all-time high of 6,978.60 on 27 January 2026, before pulling back sharply through February and into March. That reversal has split investors into two camps: those who see a healthy, temporary correction and those bracing for something more serious.
The answer sits somewhere in between, and understanding where we actually are could be the most important positioning decision you make this year.
What Defines a Bull or Bear Market?
Before reading current conditions, it helps to lock in the definitions. The table below captures the three key market phases and what each one means in practice.
Market Phase
Definition
Typical Investor Mood
Bull Market
Price rise of 20%+ from a recent low
Optimistic, risk-on
Correction
Pullback of 10% to 19% from a recent peak
Cautious, wait-and-see
Bear Market
Decline of 20%+ from a recent peak
Fearful, risk-off
These are not just labels. They signal shifts in investor sentiment, economic momentum, and risk appetite across global markets. One important nuance is that corrections are a normal feature of healthy markets. The S&P 500 has averaged an intra-year drawdown of roughly 14% since 1990, even in years that ultimately finished with positive returns. Only around one in four corrections escalate into a full bear market.
Where Markets Stand Right Now
The S&P 500 peaked at 6,978.60 in January 2026, before entering correction territory in February. Technology stocks led the decline, falling over 15%, while a sharp sell-off in March erased nearly $900 billion in a single session.
Despite this, the broader bull market that began in October 2022 remains intact, with the index still up over 90% from its low.
However, that figure is somewhat misleading. On an equal-weighted basis, gains are closer to 52%, highlighting narrow market leadership concentrated in mega-cap stocks. Historically, this kind of concentration increases vulnerability to sharper pullbacks.
The Midterm Election Year Factor
Midterm election years tend to be volatile. Since 1957, the S&P 500 has entered correction territory in 12 of 17 midterm years, with an average drawdown of around 18%.
However, the second half of the cycle is typically stronger. The six months following midterms have historically delivered average returns of about 14%, suggesting that volatility often gives way to recovery.
Key Indicators to Watch
Knowing where the market sits goes beyond tracking a single index level. Experienced traders and analysts watch a combination of signals. Here are the four most relevant ones right now.
Moving Averages
The S&P 500 has broken below its 50-day moving average, a short-term bearish signal, but remains above the 200-day moving average, which still supports a longer-term bull trend.
Valuations
Markets are trading around 22 times forward earnings, above historical averages, leaving less room for disappointment.
Tariffs and Inflation
US tariff rates have risen sharply to around 12%, increasing cost pressures and limiting the Federal Reserve’s flexibility on interest rates.
Prediction Markets
Contracts on Kalshi suggest a 58% probability that the S&P 500 could fall to 6,200 or lower this year, indicating expectations of continued volatility.
The Bull Case vs Bear Case for 2026
Arguments for the Bulls
The structural case for continued upside remains credible, and several data points support it.
Morgan Stanley notes that every bull market lasting four full years has historically delivered a positive fourth year, and 2026 marks year four of the current cycle.
US federal tax policy changes are expected to generate over $170 billion in household relief this year, which could support consumer spending and equity markets in the first half.
Share buyback authorisations are on track to hit a record of more than $1.2 trillion in 2026, a figure that has historically correlated with strong equity performance.
Goldman Sachs projects global equities to return 11% with dividends over the next 12 months, driven by earnings growth rather than further valuation expansion.
No major Wall Street strategist currently forecasts the S&P 500 ending 2026 in negative territory.
Arguments for the Bears
The risks are real and deserve equal attention.
The tariff-driven inflation environment has made it difficult for the Fed to provide the rate relief markets had been pricing in, removing one of the key tailwinds that drove the 2023 and 2024 rallies.
Valuations at 22 times forward earnings leave limited margin for error if earnings growth disappoints.
Market breadth remains narrow, with mega-cap technology stocks carrying a disproportionate share of index performance.
The April 2025 Liberation Day tariff shock showed how quickly conditions can shift: the S&P 500 fell nearly 20% before recovering to close the year up 16%. A repeat policy surprise cannot be ruled out.
That said, Yardeni Research puts the probability of a recession-driven bear market at just 20%, suggesting the base case remains a correction within an ongoing bull cycle rather than a wholesale trend reversal.
How to Position in the Bull and Bear Market
In a Bull Market
The priority is maintaining diversification and avoiding over-concentration in names that have already driven most of the gains. With non-US equity earnings growth now tracking ahead of US earnings on several measures, broadening geographic exposure makes increasing sense.
Growth assets should remain the core, but position sizing matters: holding names at stretched valuations with no margin of safety amplifies downside risk if sentiment shifts.
In a Bear Market or Correction
The focus shifts to three practical steps:
Reduce leverage to protect capital during sustained drawdowns.
Rotate toward defensive sectors such as healthcare, utilities, and consumer staples, which historically hold up better in risk-off environments.
Use weakness strategically to accumulate quality assets at more attractive valuations, rather than selling indiscriminately into declines.
In the current environment, the most important discipline is resisting the urge to make dramatic all-or-nothing decisions based on headlines. As the data above shows, corrections are common, recoveries follow, and the investors who tend to fare best are those who stay focused on evidence rather than emotion.
Conclusion
So, are we in a bull or bear market right now? Technically, the bull market that began in October 2022 remains intact. But 2026 has introduced a meaningful combination of headwinds: elevated valuations, tariff-driven margin pressure, narrow market breadth, geopolitical volatility, and the historically turbulent midterm election cycle.
The label matters less than what the underlying indicators are telling you. Track the signals, use the data, and make sure your portfolio reflects the market that actually exists rather than the one you were hoping for.
FAQs
Are we in a bull or bear market in 2026?
The bull market from October 2022 remains technically intact with over 90% gains from the low, but major indices entered correction territory in early 2026, and prediction markets price a 58% chance of further declines this year.
What is the difference between a market correction and a bear market?
A correction is a decline of 10% to 19% from a recent high. A bear market requires a drop of 20% or more. Historically, only around one in four corrections escalate into a full bear market.
How often does the S&P 500 fall in midterm election years?
The S&P 500 has entered correction territory in 12 of the 17 midterm election years since 1957. However, the six months following midterm elections have historically been the strongest of the presidential cycle, averaging returns of around 14%.
Share Now
Disclaimer:This content is provided for informational purposes only and does not constitute, and should not be construed as, financial, investment, or other professional advice. No statement or opinion contained herein should be considered a recommendation by Ultima Markets or the author regarding any specific investment product, strategy, or transaction. Readers are advised not to rely solely on this material when making investment decisions and should seek independent advice where appropriate.
Thank you for visiting the Ultima Markets website. Please note that this website is intended for individuals residing in jurisdictions where access is permitted by law. Ultima and its affiliated entities do not operate in your home jurisdiction.
By clicking ‘Acknowledge’, you confirm that you are entering this website solely on your own initiative and not as a result of any specific marketing outreach. You wish to obtain information from this website based on reverse solicitation principles, in accordance with the applicable laws of your home jurisdiction.