Important Information
This website is managed by Ultima Markets’ international entities, and it’s important to emphasise that they are not subject to regulation by the FCA in the UK. Therefore, you must understand that you will not have the FCA’s protection when investing through this website – for example:
- You will not be guaranteed Negative Balance Protection
- You will not be protected by FCA’s leverage restrictions
- You will not have the right to settle disputes via the Financial Ombudsman Service (FOS)
- You will not be protected by Financial Services Compensation Scheme (FSCS)
- Any monies deposited will not be afforded the protection required under the FCA Client Assets Sourcebook. The level of protection for your funds will be determined by the regulations of the relevant local regulator.
Note: Ultima Markets is currently developing a dedicated website for UK clients and expects to onboard UK clients under FCA regulations in 2026.
If you would like to proceed and visit this website, you acknowledge and confirm the following:
- 1.The website is owned by Ultima Markets’ international entities and not by Ultima Markets UK Ltd, which is regulated by the FCA.
- 2.Ultima Markets Limited, or any of the Ultima Markets international entities, are neither based in the UK nor licensed by the FCA.
- 3.You are accessing the website at your own initiative and have not been solicited by Ultima Markets Limited in any way.
- 4.Investing through this website does not grant you the protections provided by the FCA.
- 5.Should you choose to invest through this website or with any of the international Ultima Markets entities, you will be subject to the rules and regulations of the relevant international regulatory authorities, not the FCA.
Ultima Markets wants to make it clear that we are duly licensed and authorised to offer the services and financial derivative products listed on our website. Individuals accessing this website and registering a trading account do so entirely of their own volition and without prior solicitation.
By confirming your decision to proceed with entering the website, you hereby affirm that this decision was solely initiated by you, and no solicitation has been made by any Ultima Markets entity.
I confirm my intention to proceed and enter this website

A Guide on the Wyckoff Accumulation Pattern
The Wyckoff Accumulation Pattern is a powerful technical analysis tool designed to help traders identify the early stages of an uptrend. Developed by Richard D. Wyckoff, a pioneer in the field of technical analysis, this method focuses on understanding the behavior of institutional traders (often referred to as “smart money”) and how their actions influence price movements.
For beginners, learning the Wyckoff method can provide valuable insights into recognising accumulation phases and entering trades at the optimal time.
What is the Wyckoff Accumulation Pattern?

The Wyckoff Accumulation Pattern is part of a broader methodology developed by Richard D. Wyckoff, which focuses on market analysis through price action and volume. The main concept behind the pattern is understanding how institutional players (such as banks and large financial entities) quietly accumulate assets before a breakout to the upside.
The idea is that these institutional traders move the market, and by recognising their activities, traders can align their positions with the “smart money.”
The Wyckoff method is particularly useful for identifying periods of market consolidation, known as accumulation, where price tends to move sideways. Once large players have accumulated enough positions, a breakout to the upside is often expected, marking the start of a new uptrend.
Key Phases of the Wyckoff Accumulation Pattern
The Wyckoff Accumulation Pattern unfolds in several stages, each of which signals a different part of the market cycle. Understanding these phases helps traders know when to expect a breakout or reversal in the market.
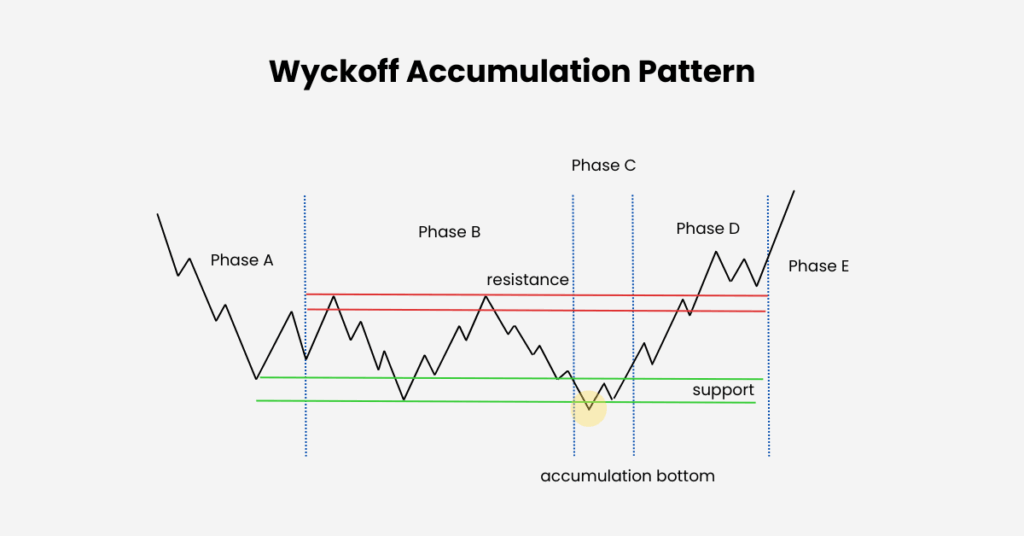
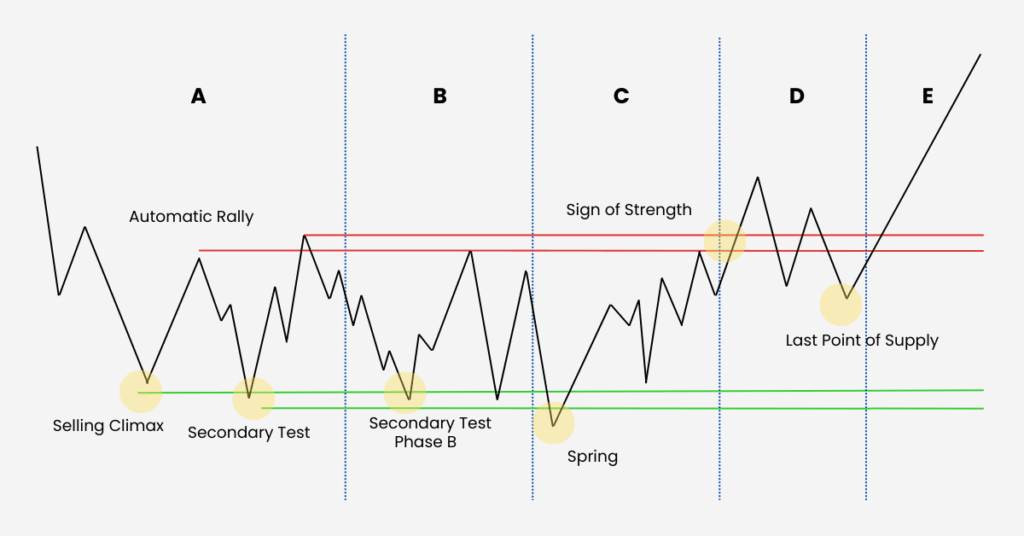
Phase A: Preliminary Support (PS) and Selling Climax (SC)
Phase A is where the market transitions from a downtrend to consolidation. Preliminary Support (PS) occurs when selling pressure begins to ease, and the market starts stabilising. The Selling Climax (SC) is the point at which a sharp drop in price signals the maximum selling point. During the SC, heavy volume indicates that institutional buyers are stepping in to absorb the selling pressure, suggesting that the downtrend is over and the market is entering a period of consolidation.
Phase B: The Trading Range
Phase B is a consolidation phase where the market price moves within a defined range of support and resistance. This phase represents the period where institutional investors accumulate positions without pushing prices higher. Volume during this phase often spikes during price declines, showing that smart money is quietly buying up assets at discounted prices. Retail traders, however, may remain uncertain and avoid making large moves.
Phase C: The Spring or Shakeout
In Phase C, the price briefly dips below the established support level, which is known as a “spring” or “shakeout.” This price move is a false breakout designed to mislead retail traders into selling their positions. The spring traps traders and allows institutional players to accumulate more assets at lower prices. A quick rebound after the spring confirms that the accumulation phase is ending and signals the start of an uptrend.
Phase D: The Markup Phase
Phase D marks the breakout of the trading range and the start of the uptrend. Prices rise steadily as demand begins to outweigh supply. This phase is characterised by higher volume, confirming that the market is transitioning into a new upward trend. The markup phase is where the smart money’s positions begin to pay off, and traders who recognised the accumulation pattern can now enter the market for potential profits.
Phase E: The End of Accumulation
In Phase E, the price continues to rise, leaving the accumulation range behind. The market has fully transitioned into an uptrend, and the breakout is now confirmed. Any pullbacks during this phase are usually short-lived, as demand continues to outweigh supply. Traders who have been following the Wyckoff Accumulation Pattern can now take advantage of the uptrend, aiming to profit from the price increases.
How to Identify the Wyckoff Accumulation Pattern
To identify the Wyckoff Accumulation Pattern, traders need to closely observe both price action and volume. Here’s how to recognise the key elements:
- Price Consolidation: After a significant downtrend, the market will often enter a sideways or consolidating phase. This is where accumulation occurs.
- Volume Spikes: During accumulation, look for spikes in volume during price declines. This indicates that institutional traders are quietly absorbing supply at lower prices.
- The Spring or Shakeout: In Phase C, the price will temporarily drop below support (the spring), only to quickly reverse. This is a signal that the accumulation phase is ending.
- Breakout and Volume Confirmation: In Phase D, the price breaks out of the consolidation range with higher volume, confirming that the uptrend is starting.
Volume Analysis in the Wyckoff Method
Volume is a critical component of the Wyckoff Accumulation Pattern. Wyckoff believed that price movements must be analysed in conjunction with volume to confirm market trends. During the accumulation phase, volume typically rises when the price is declining, signaling that large players are buying the asset. As the price breaks out in Phase D, volume should spike, confirming the start of the markup phase.
By monitoring volume patterns, traders can differentiate between genuine breakouts and false signals, helping them avoid common traps during the accumulation phase.
Wyckoff Accumulation Pattern Trading Strategy
To trade using the Wyckoff Accumulation Pattern, follow these steps:
- Identify the Accumulation Range: Look for a market that has been in a downtrend and is starting to consolidate. This is the accumulation phase.
- Watch for Volume Spikes: Pay attention to volume during price declines. A spike in volume during consolidation suggests that institutional traders are accumulating positions.
- Wait for the Spring: Look for a false breakout below support during Phase C (the spring). This is a key signal that the market is about to shift.
- Enter During the Markup: Once the price breaks above the previous resistance level in Phase D, and volume confirms the move, enter a long position.
Conclusion
The Wyckoff Accumulation Pattern is an excellent tool for traders who want to understand market cycles and make informed trading decisions. By recognising the phases of accumulation, markup, distribution, and markdown, traders can align their strategies with the actions of institutional investors.
For beginners, focusing on the Wyckoff Accumulation Pattern and learning to interpret volume and price action is a valuable first step in improving trading accuracy. As you gain experience, you can apply the Wyckoff method to better time your trades and follow the “smart money” for potentially profitable outcomes.
Disclaimer: This content is provided for informational purposes only and does not constitute, and should not be construed as, financial, investment, or other professional advice. No statement or opinion contained here in should be considered a recommendation by Ultima Markets or the author regarding any specific investment product, strategy, or transaction. Readers are advised not to rely solely on this material when making investment decisions and should seek independent advice where appropriate.
Latest Articles

FOLLOW US


Ultima Markets is a member of The Financial Commission, an international independent body responsible for resolving disputes in the Forex and CFD markets.
All clients of Ultima Markets are protected under insurance coverage provided by Willis Towers Watson (WTW), a global insurance brokerage established in 1828, with claims eligibility up to US$1,000,000 per account.
Ultima Markets is the first CFD broker to be part of United Nations Global Compact.
FOLLOW US
TRADE WITH US
RISK DISCLOSURE
Risk Warning:
Trading leveraged financial products, including Contracts for Difference (CFDs), carries a high level of risk and may result in losses exceeding your initial investment. These products are not suitable for all investors and should only be traded with funds you can afford to lose. You do not own or have any rights to the underlying assets of these derivatives (e.g., entitlement to dividends). Please ensure you fully understand the associated risks. Before trading, consider your level of experience, investment objectives, and seek independent financial advice if necessary. Refer to our legal documents and disclosures before making any trading decisions.
General Advice Warning:
The information provided on this website is general in nature and does not take into account your personal objectives, financial situation, or needs. Before acting on any advice, you should assess its appropriateness in light of your individual circumstances and consult our legal documentation.
Regional Restrictions:
The information and services on this website are not intended for residents of certain jurisdictions, including but not limited to the United States, Singapore, and any jurisdictions subject to international sanctions. For further information, please contact our customer support team.
Regulatory Information:
Ultima Markets is a trading name shared amongst multiple entities operating in various jurisdictions. These following entities are authorised to operate under the Ultima Markets brand and trademarks.
-
Ultima Markets UK Limited, reference number 470325, is authorised and regulated by the Financial Conduct Authority (FCA). Registered address: 1 Blossom Yard, Fourth Floor, London, E1 6RS, UNITED KINGDOM.
-
Ultima Markets Ltd is authorised and regulated by the Financial Services Commission (FSC) of Mauritius as a Full-Service Investment Dealer (excluding Underwriting), under licence number GB 23201593.
Registered address: 2nd Floor, The Catalyst, 40 Silicon Avenue, Ebene Cybercity, 72201, Mauritius.
Copyright © 2025 Ultima Markets Ltd. All rights reserved.
-

Messenger


Continue on Messenger
Take the conversation to your Messenger account. You can return anytime.
Scan the QR code and then send the message that appears in your Messenger.
Open Messenger on this device.
-

Instagram

Continue on Instagram
Take the conversation to your Instagram account. You can return anytime.
Scan the QR code to open Instagram. Follow @ultima_markets to send a DM.
Open Instagram on this device.
-

Live Chat
-
