This website is managed by Ultima Markets’ international entities, and it’s important to emphasise that they are not subject to regulation by the FCA in the UK. Therefore, you must understand that you will not have the FCA’s protection when investing through this website – for example:
You will not be guaranteed Negative Balance Protection
You will not be protected by FCA’s leverage restrictions
You will not have the right to settle disputes via the Financial Ombudsman Service (FOS)
You will not be protected by Financial Services Compensation Scheme (FSCS)
Any monies deposited will not be afforded the protection required under the FCA Client Assets Sourcebook. The level of protection for your funds will be determined by the regulations of the relevant local regulator.
Note: UK clients are kindly invited to visit https://www.ultima-markets.co.uk/. Ultima Markets UK expects to begin onboarding UK clients in accordance with FCA regulatory requirements in 2026.
If you would like to proceed and visit this website, you acknowledge and confirm the following:
1.The website is owned by Ultima Markets’ international entities and not by Ultima Markets UK Ltd, which is regulated by the FCA.
2.Ultima Markets Limited, or any of the Ultima Markets international entities, are neither based in the UK nor licensed by the FCA.
3.You are accessing the website at your own initiative and have not been solicited by Ultima Markets Limited in any way.
4.Investing through this website does not grant you the protections provided by the FCA.
5.Should you choose to invest through this website or with any of the international Ultima Markets entities, you will be subject to the rules and regulations of the relevant international regulatory authorities, not the FCA.
Ultima Markets wants to make it clear that we are duly licensed and authorised to offer the services and financial derivative products listed on our website. Individuals accessing this website and registering a trading account do so entirely of their own volition and without prior solicitation.
By confirming your decision to proceed with entering the website, you hereby affirm that this decision was solely initiated by you, and no solicitation has been made by any Ultima Markets entity.
Explore Gann theory with this complete trading guide. Learn how to plot Gann angles, fans, and the Square of Nine and use them to forecast markets.
A Complete Trading Guide on Gann Theory
Gann theory is a structured approach to technical analysis that studies how price and time move together. Created by William Delbert Gann in the early twentieth century, it gives traders a framework to project dynamic support and resistance, highlight probable turning windows, and plan entries and exits with clear rules.
The most used tools are Gann angles and fans, the Square of Nine, and simple time counts. Always pair them with confirmation and risk control.
What is the Gann Theory?
Gann theory assumes markets move in recurring patterns that can be mapped through proportional links between price and time. In practice this shows up as:
Gann angles and fans Angles plot a fixed amount of price per unit of time. The 1×1 maps one unit of price to one unit of time and often behaves like dynamic support or resistance. A Gann fan draws multiple angles from a key swing to outline rising or falling paths that price may respect.
Square of Nine A number spiral used to project price levels and potential reaction zones by stepping through common angular increments such as ninety or one hundred and eighty degrees. Traders look for confluence between Square of Nine levels and fan angles.
Time cycles Markets often react after recognisable counts in days, weeks, or months. Counting forward from a major high or low helps you prepare for periods when reversals are more likely.
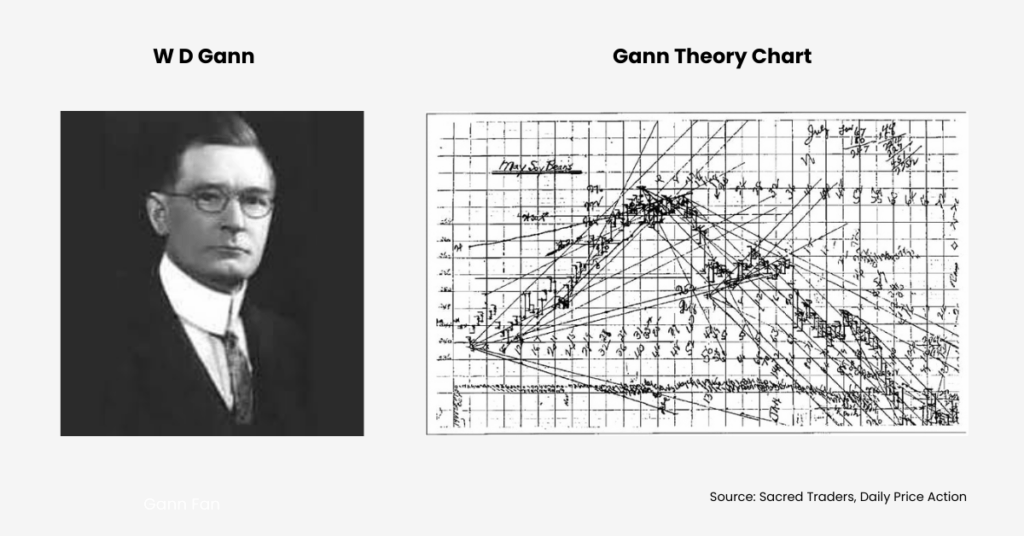
Who W D Gann Was
W D Gann was a trader and author known for strict rules and meticulous chart work. He believed natural laws govern markets and that proportional relationships between price and time can be measured. Some writings touched on astrology and numerology, which fuels debate, yet his geometric methods remain widely used.
How to Plot Gann Tools Correctly
Most errors come from scaling and anchoring. Follow these steps to keep the method consistent.
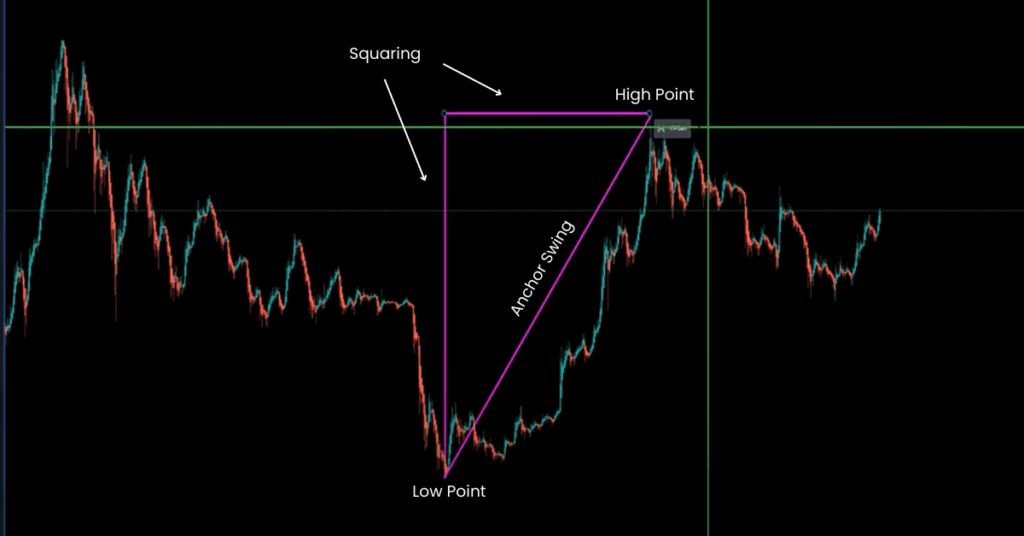
Pick a clean anchor swing Choose a major high or low that follows a clear pattern break. For example, a descending triangle that breaks into a major low followed by a strong swing high. Start your studies from that obvious turning point.
Square your chart before drawing Set a vertical from the anchor low and a horizontal from the anchor high to define your price and time box. This keeps proportions in mind when you plot angles.
Align the 45 degree guide to the 1×1 Place a 45 degree guide and match your 1×1 angle to it on the current zoom. After aligning, avoid zooming in or out while placing the fan. This preserves the price to time ratio on that timeframe.
Use logarithmic scaling when needed For instruments that trend over large ranges, turn on log scale for the chart and for any Fibonacci retracements you add. This keeps proportions meaningful across big moves.
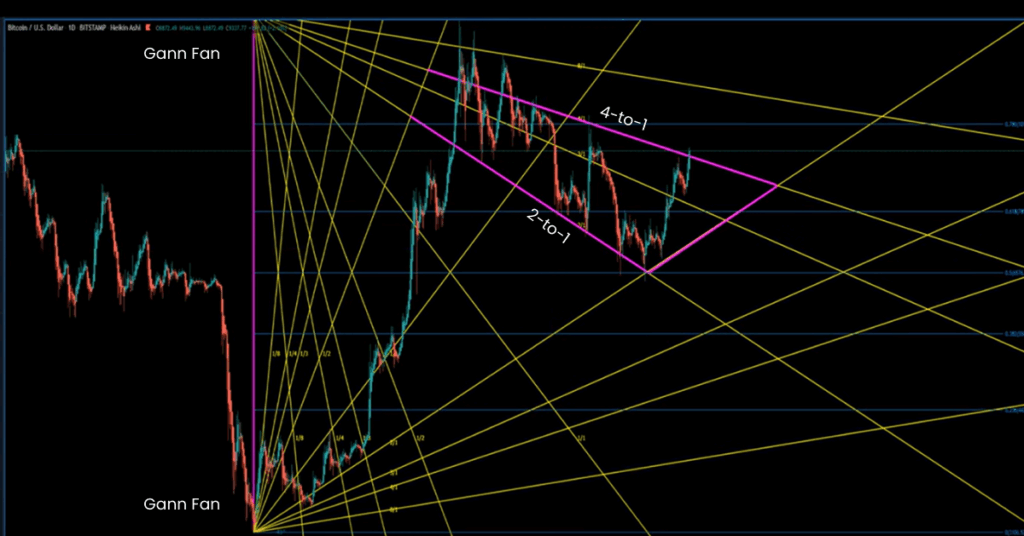
Draw the Gann fan from the anchor Project common ratios such as 1×8, 1×4, 1×3, 1×2, 1×1, 2×1, 3×1, 4×1, and 8×1. In an uptrend, holding above 1×1 signals strength. Slipping to 1×2 or 1×3 suggests slowing momentum. Reverse the logic in downtrends.
Project Square of Nine levels for confluence Find the Square of Nine value near current price, then step forward or back by common angular increments. Mark those prices. Where a Square level overlaps a fan angle, you have a higher priority zone.
Create time windows From the anchor date, count forward simple intervals in days or weeks. Note clusters that align with your price confluence. Treat dates as alerts rather than automatic trade signals.
Add confirmation and plan risk first Wait for price action confirmation at your zone. Examples include a break and retest, an engulfing reversal, or a volatility squeeze and expansion. Place stops beyond the level with modest breathing room and size positions so one loss is acceptable.
Understanding Gann Angles
Gann angles provide a geometric way to visualise how price might progress through time.
1×1 often marks a balanced market. Holding above it shows strength.
2×1 and 3×1 indicate faster rises per unit of time and can act as resistance on rallies.
1×2 and 1×3 mark slower paths and can act as support during pullbacks. Watching how price reacts at these angles helps with trend identification, entries, and exits on any timeframe.
Gann Theory and Fibonacci
Both seek structure in market movement but begin from different ideas. Gann angles come from price and time ratios and show dynamic paths. Fibonacci tools come from ratio based retracements and extensions. Many traders overlay both and act only when levels cluster.
Strategy Optimisation
Combine tools with trend lines, moving averages, and momentum oscillators to filter signals.
Backtest on historical data to see where the approach adds value and where it does not.
Adapt to conditions since effectiveness can vary with volatility and regime.
Keep risk first through position sizing, predefined stops, and clear invalidation.
Strengths vs Limitations
Strengths
Limitations
Brings time into analysis, not just price
Sensitive to anchor choice and chart scale
Projects forward paths that update with each new bar
Different traders can reach different conclusions on the same chart
Encourages disciplined planning with clear invalidation
Mixed results in mechanical tests, so confirmation is essential
Common Mistakes to Avoid
Treating the 45 degree line as universal without checking scale
Anchoring from a minor swing on a higher timeframe
Zooming after aligning the 1×1 and then drawing the fan
Trading dates or levels without confirmation
Ignoring risk limits because a tool suggests a turn
FAQs
What is the 1×1 angle It is the line that maps one unit of price to one unit of time. On a properly scaled chart it often looks like a forty five degree line and is watched as dynamic support or resistance.
Is the Square of Nine for price or time It can be used for both. Most traders begin with price projections and then add simple time counts to build windows.
Conclusion
Gann theory offers a clear way to think about the link between price and time. Used with care, it highlights paths, levels, and windows where reactions are more likely. It is not a stand alone system. Combine Gann studies with confirmation, position sizing, and risk control, and treat every projection as a plan rather than a promise.
Share Now
Disclaimer:This content is provided for informational purposes only and does not constitute, and should not be construed as, financial, investment, or other professional advice. No statement or opinion contained herein should be considered a recommendation by Ultima Markets or the author regarding any specific investment product, strategy, or transaction. Readers are advised not to rely solely on this material when making investment decisions and should seek independent advice where appropriate.
Thank you for visiting the Ultima Markets website. Please note that this website is intended for individuals residing in jurisdictions where access is permitted by law. Ultima and its affiliated entities do not operate in your home jurisdiction.
By clicking ‘Acknowledge’, you confirm that you are entering this website solely on your own initiative and not as a result of any specific marketing outreach. You wish to obtain information from this website based on reverse solicitation principles, in accordance with the applicable laws of your home jurisdiction.