Important Information
This website is managed by Ultima Markets’ international entities, and it’s important to emphasise that they are not subject to regulation by the FCA in the UK. Therefore, you must understand that you will not have the FCA’s protection when investing through this website – for example:
- You will not be guaranteed Negative Balance Protection
- You will not be protected by FCA’s leverage restrictions
- You will not have the right to settle disputes via the Financial Ombudsman Service (FOS)
- You will not be protected by Financial Services Compensation Scheme (FSCS)
- Any monies deposited will not be afforded the protection required under the FCA Client Assets Sourcebook. The level of protection for your funds will be determined by the regulations of the relevant local regulator.
Note: UK clients are kindly invited to visit https://www.ultima-markets.co.uk/. Ultima Markets UK expects to begin onboarding UK clients in accordance with FCA regulatory requirements in 2026.
If you would like to proceed and visit this website, you acknowledge and confirm the following:
- 1.The website is owned by Ultima Markets’ international entities and not by Ultima Markets UK Ltd, which is regulated by the FCA.
- 2.Ultima Markets Limited, or any of the Ultima Markets international entities, are neither based in the UK nor licensed by the FCA.
- 3.You are accessing the website at your own initiative and have not been solicited by Ultima Markets Limited in any way.
- 4.Investing through this website does not grant you the protections provided by the FCA.
- 5.Should you choose to invest through this website or with any of the international Ultima Markets entities, you will be subject to the rules and regulations of the relevant international regulatory authorities, not the FCA.
Ultima Markets wants to make it clear that we are duly licensed and authorised to offer the services and financial derivative products listed on our website. Individuals accessing this website and registering a trading account do so entirely of their own volition and without prior solicitation.
By confirming your decision to proceed with entering the website, you hereby affirm that this decision was solely initiated by you, and no solicitation has been made by any Ultima Markets entity.
I confirm my intention to proceed and enter this website Please direct me to the website operated by Ultima Markets , regulated by the FCA in the United Kingdom
Ultima Markets App
Trade Anytime, Anywhere


Forex Chart Patterns: 10 Key Setups for Traders
Chart patterns are an essential part of chart pattern analysis, which helps traders anticipate future price
movements based on historical data. These formations provide valuable insights into market sentiment,
allowing traders to identify opportunities and manage risk effectively.
Mastering forex chart patterns can give traders a competitive edge, whether they are day traders, swing
traders, or long-term investors. In this guide, we’ll explore the most important trading patterns, how they
work, and how to apply them in real-world trading.
What Is a Chart Pattern?
A chart pattern is a visual formation on a price chart that signals a potential trend continuation or
reversal. These patterns occur due to repeated market behaviour, reflecting shifts in supply and demand.
Traders use chart pattern analysis to predict price movements and improve their decision-making.
Recognising these patterns early can help execute trades with better timing. While there are no patterns
that can guarantee success, combining them with technical indicators and trendline patterns can enhance
trading accuracy.
Understanding the Different Types of Forex Patterns
Forex chart patterns fall into three main categories, each helping traders refine their chart pattern analysis
and make informed decisions.
Reversal Patterns
Reversal patterns signal a shift in trend direction. They form when buying or selling pressure
weakens, leading to a potential trend change. Identify these forex patterns early to anticipate new
market movements.
Continuation Patterns
Continuation patterns suggest a brief pause before the existing trend resumes. They indicate
market consolidation, where traders take a moment to reassess before pushing the price further in
the same direction. Spot these trading patterns to stay in profitable trades longer.
Bilateral Patterns
Bilateral patterns reflect market indecision, meaning the price could break out in either direction.
Traders wait for confirmation signals, such as a breakout, before entering a position. Use these
trendline patterns to determine key breakout points for better trade execution.
10 Important Chart Patterns for Trading
Mastering forex chart patterns helps traders identify potential trend reversals and continuations for more
strategic trade execution. These patterns provide insight into market sentiment, making chart pattern analysis a key component of technical trading.
Reversal Patterns
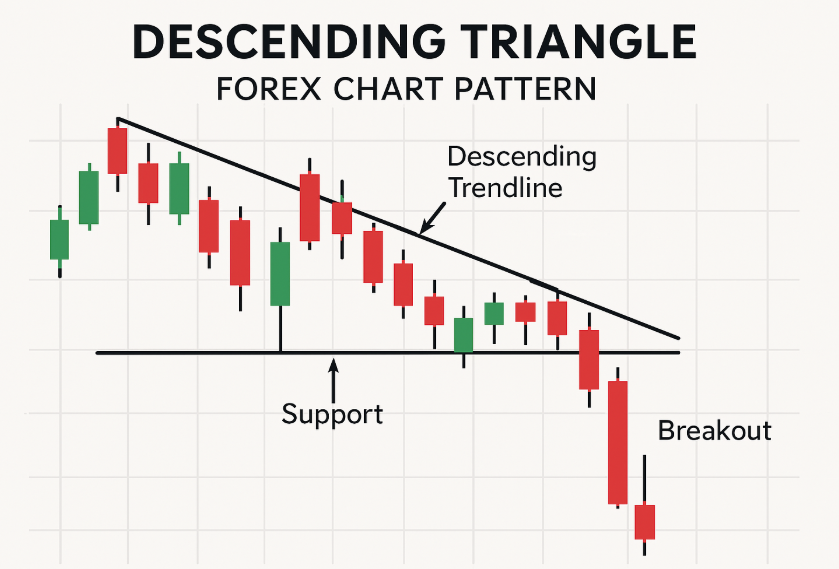
- Descending Triangle – The bearish counterpart of the Ascending Triangle, with lower highs
pressing against a flat support level, awaiting a breakdown.
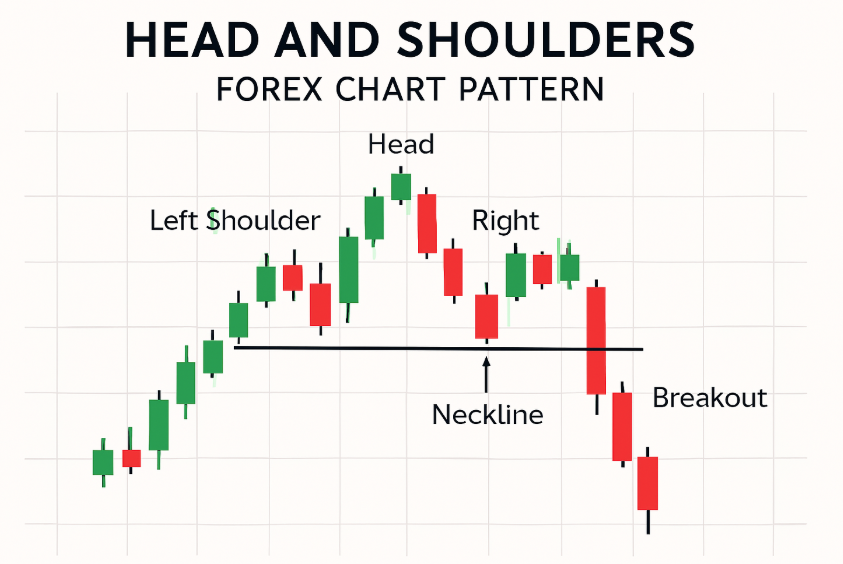
- Head and Shoulders – A classic reversal pattern that signals the end of an uptrend. A break
below the neckline confirms a bearish shift.
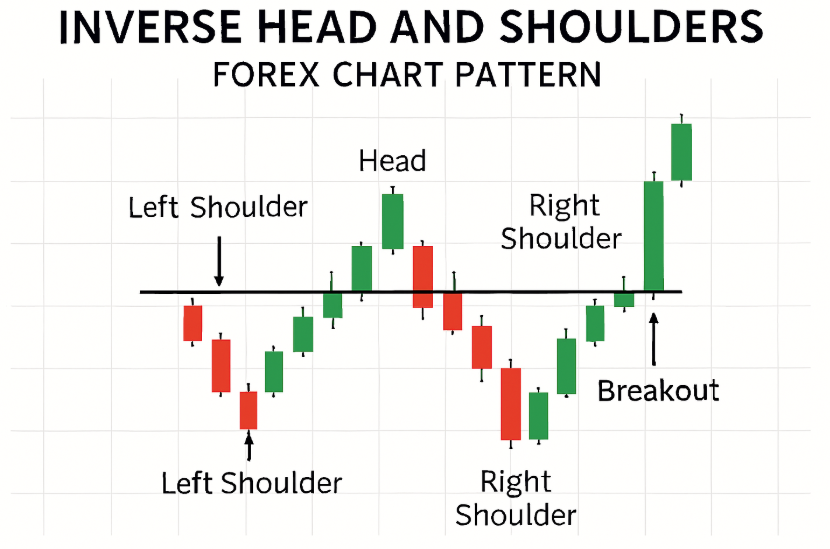
- Inverse Head and Shoulders – The opposite of the Head and Shoulders pattern, signalling the
transition from a downtrend to an uptrend once the neckline is breached.
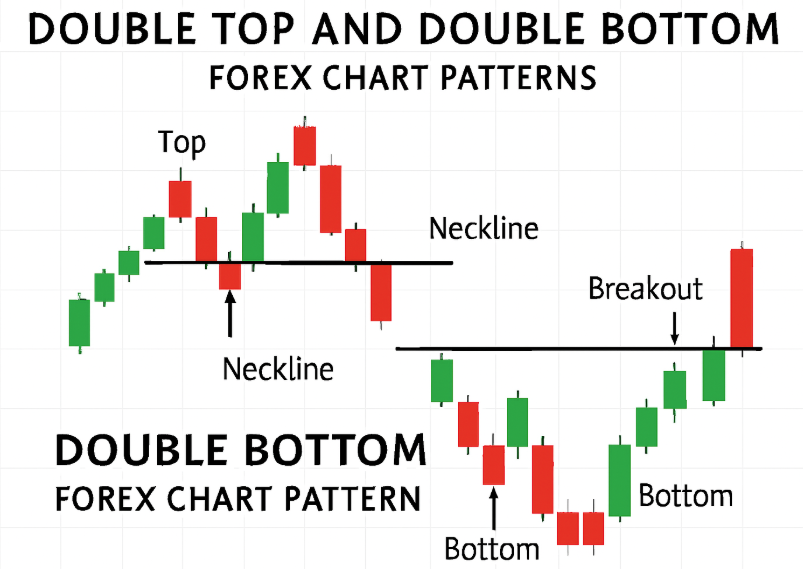
- Double Top and Double Bottom – These formations indicate a failed attempt to break resistance
(Double Top) or support (Double Bottom), leading to a potential trend reversal.
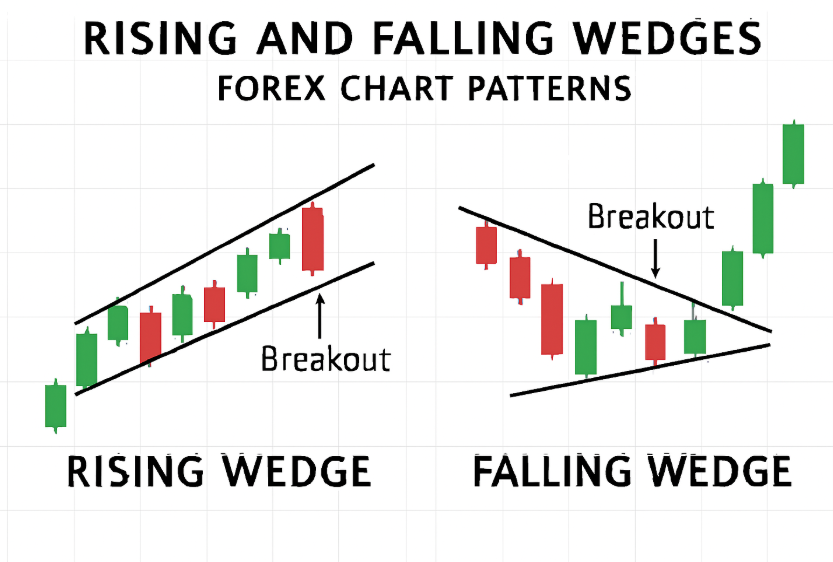
- Rising and Falling Wedges – These trendline patterns suggest a slowing trend before a
breakout. Rising Wedges typically precede bearish reversals, while Falling Wedges signal bullish
reversals.
Continuation Patterns
- Rising and Falling Wedges – Unlike their role in reversals, Wedges can also act as continuation
patterns when forming within an ongoing trend. A breakout in the prevailing trend direction
confirms continuation.
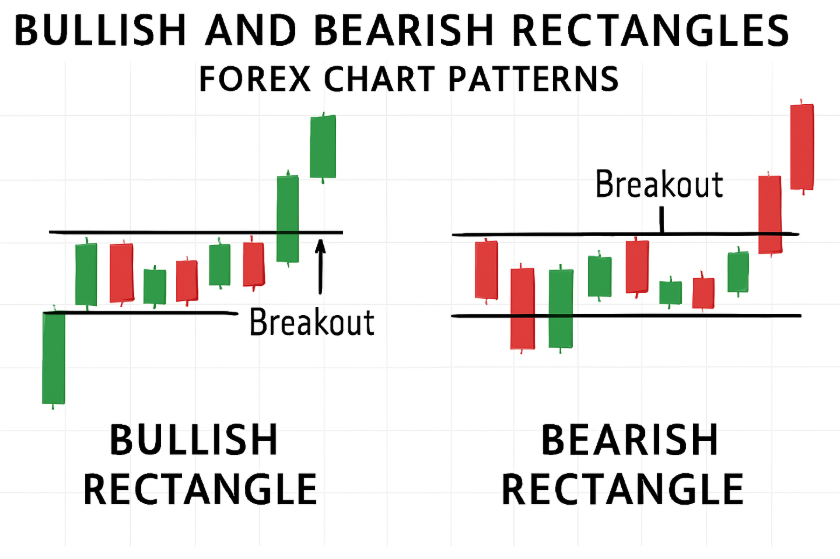
- Bullish and Bearish Rectangles – A trading pattern where the price moves within parallel
support and resistance lines before breaking out in the direction of the existing trend.
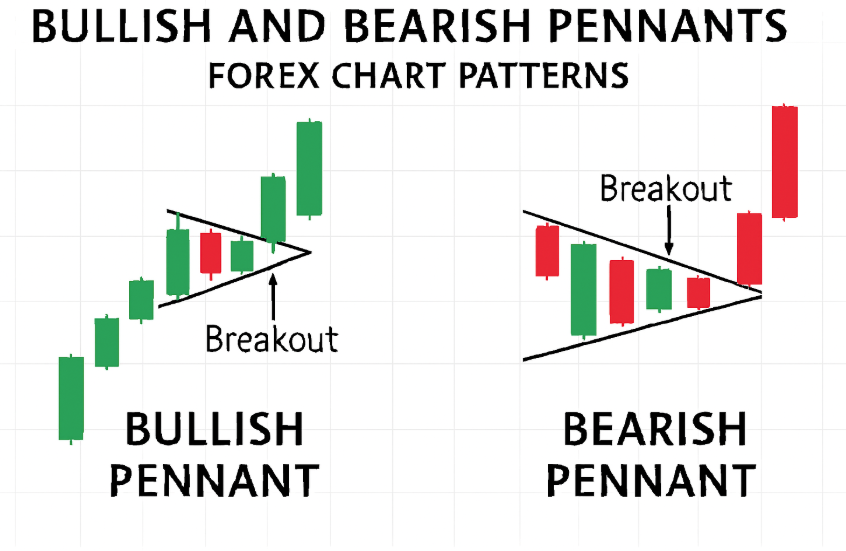
- Bullish and Bearish Pennants – Small forex patterns resembling Symmetrical Triangles, forming
after sharp price movements and indicating potential breakouts.
Bilateral Patterns
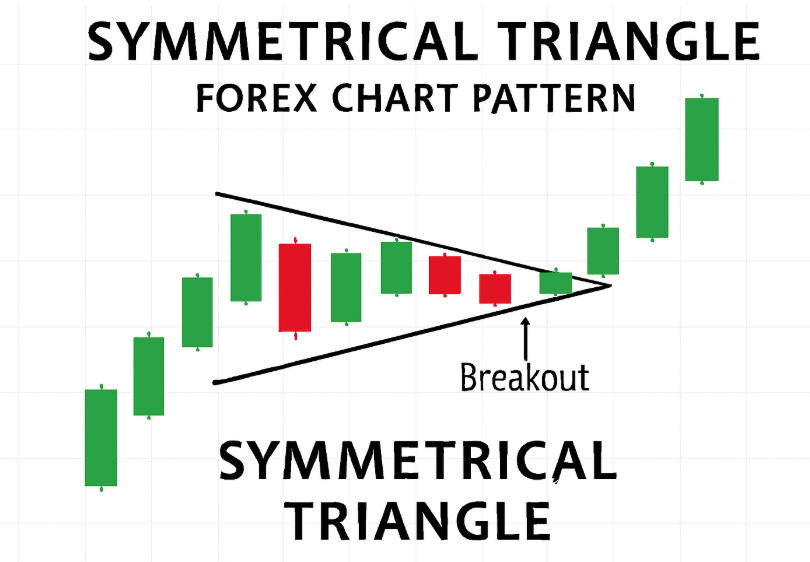
- Symmetrical Triangle – A pattern where price consolidates between converging trendlines,
signalling an impending breakout in either direction.
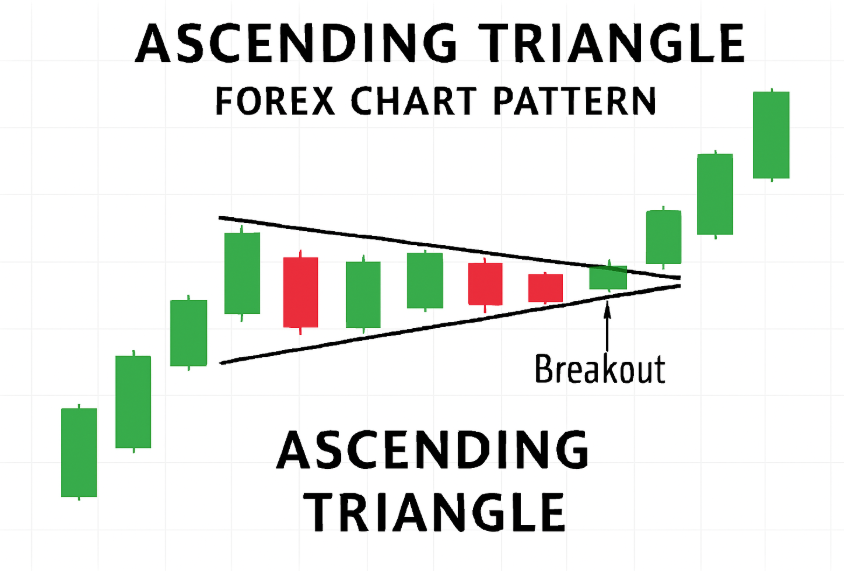
- Ascending Triangle – A typically bullish pattern featuring a horizontal resistance level and rising
lows, requiring a breakout confirmation.
How to Apply Chart Patterns in Forex Trading
Recognising forex chart patterns is only the first step, knowing how to trade them effectively is what
makes the difference. To maximise their potential, traders must follow these key steps:
Validate Chart Patterns Before Trading
A trading pattern is only reliable when confirmed with additional chart pattern analysis tools like
volume, moving averages (MA), or relative strength index (RSI). To reduce false signals, breakout
strength, trend direction, and market conditions should align before entering a trade.
Use Stop-Losses to Protect Your Trades
Placing stop-loss orders beyond key trendline pattern levels helps minimise losses from sudden
price reversals. For example, in a Double Top, a stop-loss above the peaks prevents excessive
downside risk if the price retests resistance.
Set Profit Targets Based on Chart Patterns
Profit targets are typically determined using the pattern’s measured move. In a forex pattern like a
Head and Shoulders, the expected price movement equals the distance between the head and
neckline, offering a logical exit strategy.
Master Chart Patterns for Smarter Trading
Learning to identify forex chart patterns can significantly improve a trader’s ability to predict price
movements. Whether focusing on reversal, continuation, or bilateral patterns, recognising key setups
helps traders make better decisions and manage risk effectively.
For traders looking to refine their chart pattern analysis, Ultima Markets offers real-time market insights
and advanced charting tools. Start trading with confidence today, unlock new opportunities and enhance
your trading performance with Ultima Markets!
FAQs
How reliable are forex chart patterns?
While no pattern is foolproof, combining chart pattern analysis with technical indicators can
improve accuracy. The reliability depends on volume, breakout strength, and market conditions.
Can chart patterns be used for short-term trading?
Yes, forex patterns apply to all timeframes. Scalpers and day traders use them for short-term
setups, while swing traders look at longer patterns for sustained trends.
What is the difference between a trendline pattern and a chart pattern?
A trendline pattern helps identify the market direction, while a chart pattern signals potential
reversals or continuations within that trend.
How do I know when a pattern has failed?
A trading pattern fails when the price moves in the opposite direction after breaking key levels.
Using stop-losses prevents large losses when this happens.
Are chart patterns effective in all market conditions?
Patterns work best in trending markets. In choppy or low-volume conditions, forex chart patterns
may be less reliable and require extra confirmation.
Disclaimer: This content is provided for informational purposes only and does not constitute, and should not be construed as, financial, investment, or other professional advice. No statement or opinion contained here in should be considered a recommendation by Ultima Markets or the author regarding any specific investment product, strategy, or transaction. Readers are advised not to rely solely on this material when making investment decisions and should seek independent advice where appropriate.
Latest Articles


FOLLOW US


Ultima Markets is a member of The Financial Commission, an international independent body responsible for resolving disputes in the Forex and CFD markets.
All clients of Ultima Markets are protected under insurance coverage provided by Willis Towers Watson (WTW), a global insurance brokerage established in 1828, with claims eligibility up to US$1,000,000 per account.
Ultima Markets is the first United CFD broker to be part of the United Nations Global Compact.
FOLLOW US
TRADE WITH US
RISK DISCLOSURE
Risk Warning:
Trading leveraged financial products, including Contracts for Difference (CFDs), carries a high level of risk and may result in losses exceeding your initial investment. These products are not suitable for all investors and should only be traded with funds you can afford to lose. You do not own or have any rights to the underlying assets of these derivatives (e.g., entitlement to dividends). Please ensure you fully understand the associated risks. Before trading, consider your level of experience, investment objectives, and seek independent financial advice if necessary. Refer to our legal documents and disclosures before making any trading decisions.
General Advice Warning:
The information provided on this website is general in nature and does not take into account your personal objectives, financial situation, or needs. Before acting on any advice, you should assess its appropriateness in light of your individual circumstances and consult our legal documentation.
Regional Restrictions:
The information and services on this website are not intended for residents of certain jurisdictions, including but not limited to the United States, United Kingdom, Singapore, and any jurisdictions subject to international sanctions. For further information, please contact our customer support team.
Regulatory Information:
Ultima Markets is a trading name shared amongst multiple entities operating in various jurisdictions. These following entities are authorised to operate under the Ultima Markets brand and trademarks.
-
Ultima Markets UK Limited, reference number 470325, is authorised and regulated by the Financial Conduct Authority (FCA). Registered address: 1 Blossom Yard, Fourth Floor, London, E1 6RS, UNITED KINGDOM.
-
Ultima Markets Ltd is authorised and regulated by the Financial Services Commission (FSC) of Mauritius as a Full-Service Investment Dealer (excluding Underwriting), under licence number GB 23201593.
Registered address: 2nd Floor, The Catalyst, 40 Silicon Avenue, Ebene Cybercity, 72201, Mauritius.
-
Ultima Markets EU OÜ, incorporated in Estonia with registry code 17134727. Registered address: Harju maakond, Tallinn, Kristiine linnaosa, Seebi tn 1-1501, 11316. This entity does not offer regulated financial products or provide trading services.
Copyright © 2026 Ultima Markets Ltd. All rights reserved.
-

Messenger


Continue on Messenger
Take the conversation to your Messenger account. You can return anytime.
Scan the QR code and then send the message that appears in your Messenger.
Open Messenger on this device.
-

Instagram

Continue on Instagram
Take the conversation to your Instagram account. You can return anytime.
Scan the QR code to open Instagram. Follow @ultima_markets to send a DM.
Open Instagram on this device.
-

Live Chat
-
