This website is managed by Ultima Markets’ international entities, and it’s important to emphasise that they are not subject to regulation by the FCA in the UK. Therefore, you must understand that you will not have the FCA’s protection when investing through this website – for example:
You will not be guaranteed Negative Balance Protection
You will not be protected by FCA’s leverage restrictions
You will not have the right to settle disputes via the Financial Ombudsman Service (FOS)
You will not be protected by Financial Services Compensation Scheme (FSCS)
Any monies deposited will not be afforded the protection required under the FCA Client Assets Sourcebook. The level of protection for your funds will be determined by the regulations of the relevant local regulator.
Note: UK clients are kindly invited to visit https://www.ultima-markets.co.uk/. Ultima Markets UK expects to begin onboarding UK clients in accordance with FCA regulatory requirements in 2026.
If you would like to proceed and visit this website, you acknowledge and confirm the following:
1.The website is owned by Ultima Markets’ international entities and not by Ultima Markets UK Ltd, which is regulated by the FCA.
2.Ultima Markets Limited, or any of the Ultima Markets international entities, are neither based in the UK nor licensed by the FCA.
3.You are accessing the website at your own initiative and have not been solicited by Ultima Markets Limited in any way.
4.Investing through this website does not grant you the protections provided by the FCA.
5.Should you choose to invest through this website or with any of the international Ultima Markets entities, you will be subject to the rules and regulations of the relevant international regulatory authorities, not the FCA.
Ultima Markets wants to make it clear that we are duly licensed and authorised to offer the services and financial derivative products listed on our website. Individuals accessing this website and registering a trading account do so entirely of their own volition and without prior solicitation.
By confirming your decision to proceed with entering the website, you hereby affirm that this decision was solely initiated by you, and no solicitation has been made by any Ultima Markets entity.
Ultima Markets does not have an establishment in Singapore and does not operate from Singapore.
Ultima Markets does not provide products or services to citizens or residents of Singapore, and account applications from Singapore citizens or residents will not be accepted.
If you are a citizen or resident of Singapore, please do not open an account or use Ultima Markets’ products or services.
By selecting “Acknowledge and Continue Browsing”, you confirm that you are accessing this website on your own initiative and that your access is not the result of any direct marketing, targeted advertising, solicitation, or promotional activity by Ultima Markets.
Nothing on this website constitutes an offer, solicitation, or promotion of products or services in any jurisdiction where such activity is prohibited. You are responsible for ensuring that your access to and use of this website complies with applicable local laws and regulations.
In this comprehensive analysis, Ultima Markets brings you an insightful breakdown of USDCHF for November 05, 2026.
Technical Analysis of USDCHF
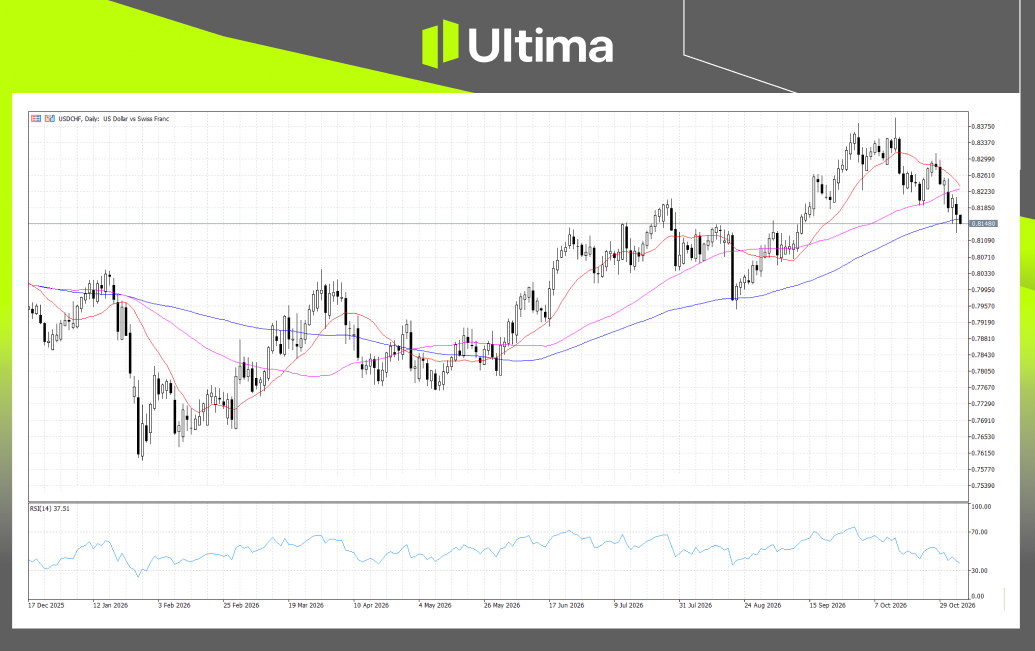
USDCHF Daily Chart Insight
(USDCHF Daily Chart, Source: Ultima Markets MT5)
USDCHF has entered a bearish correction following its strong recovery from the May lows and subsequent rally towards the 0.8375 region in early October. The pair has since formed a series of lower highs and lower lows, indicating increasing selling pressure. Price has fallen below both the red 16-period moving average (MA16) and purple 50-period moving average (MA50), while recently slipping beneath the blue 100-period moving average (MA100) near 0.8150. The MA16 is turning lower, reflecting weakening short-term momentum, whereas the MA50 and MA100 retain their broader upward trajectories.
The daily RSI stands at 37.51, reinforcing the bearish bias without indicating oversold conditions. Sellers currently hold the advantage, although the longer-term bullish structure has not been fully invalidated. A sustained break below the MA100 could expose further downside towards 0.8109, while a recovery above the 0.8223–0.8261 resistance region would be required to ease the prevailing selling pressure.
Key Levels:
Support 1 (0.8109): Immediate downside support near a previous consolidation area, which may attract buying interest if the price remains below the MA100.
Support 2 (0.8033): A lower support region associated with previous price consolidation and reactions during July and August.
Support 3 (0.7975): A broader structural support area that previously provided a foundation for the subsequent recovery.
Resistance 1 (0.8185): Immediate resistance near the recently broken price region, where a recovery could encounter renewed selling pressure.
Resistance 2 (0.8223–0.8261): A significant resistance zone encompassing the red MA16 and purple MA50, where sellers may defend the prevailing correction.
Resistance 3 (0.8299–0.8337): A higher resistance region associated with previous October trading activity and swing highs.
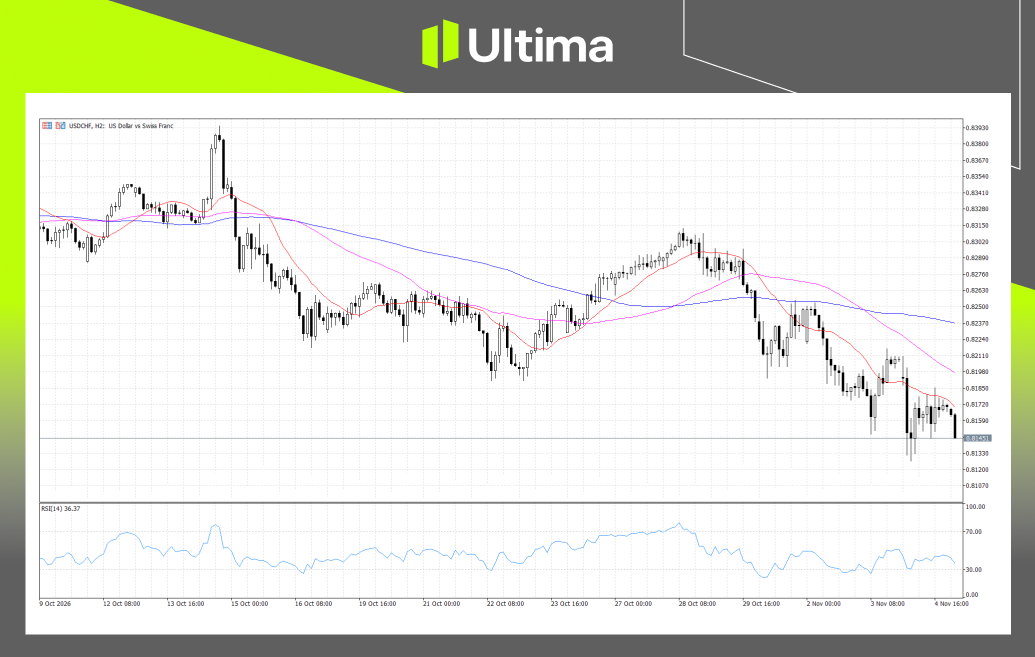
USDCHF 2-Hour Chart Analysis
(USDCHF 2-Hour Chart, Source: Ultima Markets MT5)
USDCHF maintains a bearish short-term structure on the 2-hour chart, with successive lower highs and lower lows confirming sustained selling pressure since the late-October peak near 0.8315. Price remains below the declining red 16-period moving average (MA16), purple 50-period moving average (MA50), and blue 100-period moving average (MA100), with their bearish alignment reinforcing sellers’ control. Recent attempts to recover towards the 0.8211 region have been rejected, followed by another decline towards 0.8145.
The RSI currently reads 36.37, indicating persistent bearish momentum without reaching oversold territory. Although a temporary rebound or sideways consolidation remains possible following the recent decline, the broader H2 bias remains bearish unless buyers reclaim the immediate resistance levels and establish a more convincing recovery above the MA16.
Breakout Scenarios:
Bullish continuation is a possible countertrend scenario, triggered by a decisive break and hold above 0.8172. Such a recovery could open the way towards 0.8198–0.8211, where the declining MA50 and previous resistance may limit further gains.
Bearish correction is the higher-probability outcome, triggered by a sustained breakdown below 0.8145. This would reinforce the existing downtrend and expose the 0.8133–0.8120 support region, particularly if the RSI continues weakening towards the oversold threshold.
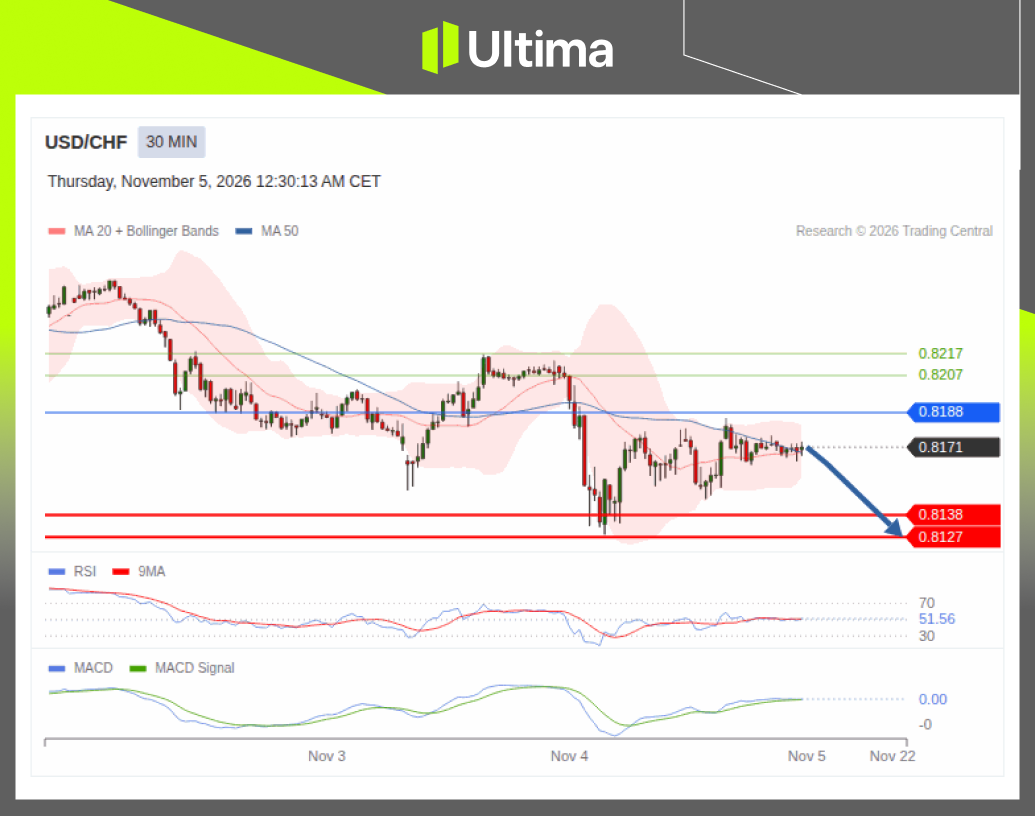
USDCHF Pivot Indicator
(USDCHF 30-Minute Chart, Source: Trading Central)
USDCHF is trading around 0.8171 on the 30-minute chart, remaining below the main pivot resistance at 0.8188. The pair has consolidated within a narrow range following its earlier decline, suggesting that bearish pressure persists despite temporary stabilisation. The RSI stands at 51.56, slightly above the neutral 50 level, indicating that immediate momentum is relatively balanced rather than strongly bearish.
Meanwhile, the MACD and signal line are converging near the zero level, reflecting limited directional momentum. Although the Trading Central outlook favours further downside while price remains below 0.8188, a decisive break from the current consolidation is required to confirm the next directional move.
Bearish Breakdown: A sustained move below 0.8171 while remaining beneath the 0.8188 pivot would reinforce the bearish preference, with downside targets at 0.8138, followed by 0.8127. Confirmation would strengthen if the RSI falls below 50 and the MACD turns lower, with the MACD line crossing beneath its signal line.
Bullish Reversal: A decisive break and sustained hold above the 0.8188 pivot would weaken the immediate bearish outlook and open the way towards 0.8207, followed by 0.8217. Stronger bullish confirmation would require the RSI to remain above 50 and move higher, alongside a bullish MACD crossover and improving positive momentum.
DisclaimerComments, news, research, analysis, price, and all information contained in the article only serve as general information for readers and do not suggest any advice. Ultima Markets has taken reasonable measures to provide up-to-date information, but cannot guarantee accuracy, and may modify without notice. Ultima Markets will not be responsible for any loss incurred due to the application of the information provided.
Thank you for visiting the Ultima Markets website. Please note that this website is intended for individuals residing in jurisdictions where access is permitted by law. Ultima and its affiliated entities do not operate in your home jurisdiction.
By clicking ‘Acknowledge’, you confirm that you are entering this website solely on your own initiative and not as a result of any specific marketing outreach. You wish to obtain information from this website based on reverse solicitation principles, in accordance with the applicable laws of your home jurisdiction.