This website is managed by Ultima Markets’ international entities, and it’s important to emphasise that they are not subject to regulation by the FCA in the UK. Therefore, you must understand that you will not have the FCA’s protection when investing through this website – for example:
You will not be guaranteed Negative Balance Protection
You will not be protected by FCA’s leverage restrictions
You will not have the right to settle disputes via the Financial Ombudsman Service (FOS)
You will not be protected by Financial Services Compensation Scheme (FSCS)
Any monies deposited will not be afforded the protection required under the FCA Client Assets Sourcebook. The level of protection for your funds will be determined by the regulations of the relevant local regulator.
Note: UK clients are kindly invited to visit https://www.ultima-markets.co.uk/. Ultima Markets UK expects to begin onboarding UK clients in accordance with FCA regulatory requirements in 2026.
If you would like to proceed and visit this website, you acknowledge and confirm the following:
1.The website is owned by Ultima Markets’ international entities and not by Ultima Markets UK Ltd, which is regulated by the FCA.
2.Ultima Markets Limited, or any of the Ultima Markets international entities, are neither based in the UK nor licensed by the FCA.
3.You are accessing the website at your own initiative and have not been solicited by Ultima Markets Limited in any way.
4.Investing through this website does not grant you the protections provided by the FCA.
5.Should you choose to invest through this website or with any of the international Ultima Markets entities, you will be subject to the rules and regulations of the relevant international regulatory authorities, not the FCA.
Ultima Markets wants to make it clear that we are duly licensed and authorised to offer the services and financial derivative products listed on our website. Individuals accessing this website and registering a trading account do so entirely of their own volition and without prior solicitation.
By confirming your decision to proceed with entering the website, you hereby affirm that this decision was solely initiated by you, and no solicitation has been made by any Ultima Markets entity.
Ultima Markets does not have an establishment in Singapore and does not operate from Singapore.
Ultima Markets does not provide products or services to citizens or residents of Singapore, and account applications from Singapore citizens or residents will not be accepted.
If you are a citizen or resident of Singapore, please do not open an account or use Ultima Markets’ products or services.
By selecting “Acknowledge and Continue Browsing”, you confirm that you are accessing this website on your own initiative and that your access is not the result of any direct marketing, targeted advertising, solicitation, or promotional activity by Ultima Markets.
Nothing on this website constitutes an offer, solicitation, or promotion of products or services in any jurisdiction where such activity is prohibited. You are responsible for ensuring that your access to and use of this website complies with applicable local laws and regulations.
Explore the gold price highest ever, what drove the record high, key historical peaks, and what traders should watch as gold approaches new highs again.
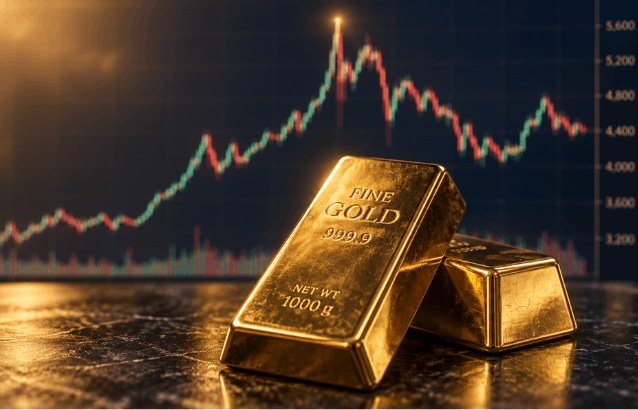
Looking for the gold price highest ever? Gold’s nominal US-dollar spot record dates to 29 January 2026, when Reuters reported US$5,594.82 per troy ounce. Other price feeds show slightly different peaks around US$5,600.
Yet the record is only the starting point. The more revealing questions are why investors pushed gold so high, what made this rally different and why prices subsequently reversed.
What Counts as the Highest Gold Price?
Spot gold fluctuates throughout the trading day. By contrast, the LBMA Gold Price is established through two daily auctions. Its morning benchmark reached US$5,501.70 on 29 January 2026, below Reuters’ intraday spot peak.
Neither figure invalidates the other. They measure prices at different moments. When comparing records, check the currency, price source and whether the figure is an intraday high or a benchmark.
A Brief History of Gold’s Record Highs
Modern gold-price history has an important turning point in August 1971, when the United States suspended dollar convertibility into gold. The previous official conversion rate of US$35 an ounce was not equivalent to today’s freely traded spot price.
Period
Reported price milestone
Main backdrop
January 1980
US$850
Inflation and oil shocks.
2011
Above US$1,900
An uneven post-crisis recovery.
August 2020
Above US$2,000
The pandemic and investment inflows.
January 2026
Around US$5,600
Strong investment demand and momentum.
These milestones use different reported price series and should not be treated as a single benchmark dataset.
1980 when inflation dominated
The 1980 peak followed oil shocks and concerns about inflation. Investors sought protection against economic and geopolitical uncertainty.
The policy response eventually changed the environment. The Federal Reserve maintained tight monetary conditions, bringing inflation down over the following years. The lesson is that gold’s outlook depends not only on inflation, but also on how policymakers respond to it.
2011 when financial uncertainty persisted
The next major episode reflected the financial crisis and its aftermath. An uneven recovery, monetary easing and dollar weakness encouraged investors towards gold, which traded above US$1,900 in 2011.
Unlike 1980, this was not simply a response to rapidly rising consumer prices. Concerns about economic stability and the consequences of extraordinary monetary support also mattered.
2020 when the pandemic accelerated buying
Pandemic disruption, very low interest rates and government support drove another surge in investment demand. Gold-backed exchange-traded funds, or ETFs, added approximately 877 tonnes during 2020.
However, successful vaccine announcements later improved confidence and encouraged investors towards riskier assets. Gold ETFs recorded fourth-quarter outflows, demonstrating how quickly demand for protection could weaken when expectations changed.
Why Gold Reached New Highs in 2025 and 2026
The latest rally was not simply a repeat of the pandemic. The World Gold Council reported 53 new highs in the LBMA afternoon benchmark during 2025, supported by strong investment demand.
Importantly, central-bank purchases slowed. Net buying totalled approximately 863 tonnes, down 21% from 2024. Meanwhile, gold ETF holdings increased by approximately 801 tonnes. Central banks remained substantial buyers, but investment flows supplied an increasingly important source of support.
Nor was the rally caused by collapsing mine output. Initial estimates put 2025 production at a record 3,672 tonnes, while jewellery consumption fell 18% by volume. Taken together, these figures suggest an investment-led rally rather than a jewellery boom or a sudden production collapse.
Momentum intensified in January 2026. The World Gold Council reported a 14% monthly gain and another 120 tonnes of ETF additions. Its analysis also identified substantial options activity, suggesting that market positioning amplified the advance.
Why Gold Fell After Its January Record
The reversal was almost immediate. On 30 January 2026, Reuters reported spot gold down 9.5% at US$4,883.62 at 18:57 GMT. Analysts cited profit-taking, dollar movements and changing expectations for inflation-adjusted bond yields.
Pressure continued. The LBMA afternoon benchmark stood at US$4,026.05 on 30 June. LBMA’s review linked the decline partly to rising oil prices, inflation concerns and expectations of tighter monetary policy.
This explains an apparent contradiction. Inflation can encourage buying for protection, but it can also raise expectations for interest rates. Higher returns on interest-bearing assets can reduce the appeal of gold, which pays no interest. The market’s response to inflation can therefore matter as much as inflation itself.
The path was not one-way. Gold rebounded 13.3% in August, supported by ETF buying and a weaker dollar. Yet at 06:23 GMT on 23 September, Reuters reported spot gold at US$4,329.31 as elevated-rate expectations and dollar strength weighed on sentiment.
Gold Price Highest Ever Versus Inflation-Adjusted Highs
A nominal record is the highest quoted price. An inflation-adjusted record accounts for changes in purchasing power.
That distinction matters when comparing 1980 with 2026. US$850 bought considerably more in 1980 than the same amount buys now. A rigorous comparison should specify its inflation index and reference period, rather than use an undated “today’s money” estimate.
An inflation-adjusted comparison provides context. It does not establish gold’s fair value or predict its next move.
What Traders Can Learn From Gold’s Records
The story behind the gold price highest ever is more useful than the number alone. Across these episodes, investment demand, uncertainty and interest-rate expectations are combined in different ways.
A useful approach is to analyse what supports the current precious metal price and what could undermine those assumptions. Are investment flows strengthening? Are inflation-adjusted yields rising? Is the dollar moving against gold?
Above all, treat an all-time high as historical context, not a standalone signal to buy or sell.
FAQ
What is the highest gold price ever recorded?
Reuters reported an intraday spot-gold record of US$5,594.82 per troy ounce on 29 January 2026. Exact peaks vary between price feeds.
When did gold first exceed US$2,000?
Gold first rose above US$2,000 per troy ounce in August 2020 during the pandemic-era rally.
Does inflation always push gold higher?
No. Inflation can support demand, but higher interest rates and a stronger dollar can offset that support.
Can gold fall after reaching an all-time high?
Yes. The sharp reversal after January 2026 shows that a record price does not guarantee further gains.
Share Now
Disclaimer:This content is provided for informational purposes only and does not constitute, and should not be construed as, financial, investment, or other professional advice. No statement or opinion contained herein should be considered a recommendation by Ultima Markets or the author regarding any specific investment product, strategy, or transaction. Readers are advised not to rely solely on this material when making investment decisions and should seek independent advice where appropriate.
Thank you for visiting the Ultima Markets website. Please note that this website is intended for individuals residing in jurisdictions where access is permitted by law. Ultima and its affiliated entities do not operate in your home jurisdiction.
By clicking ‘Acknowledge’, you confirm that you are entering this website solely on your own initiative and not as a result of any specific marketing outreach. You wish to obtain information from this website based on reverse solicitation principles, in accordance with the applicable laws of your home jurisdiction.