This website is managed by Ultima Markets’ international entities, and it’s important to emphasise that they are not subject to regulation by the FCA in the UK. Therefore, you must understand that you will not have the FCA’s protection when investing through this website – for example:
You will not be guaranteed Negative Balance Protection
You will not be protected by FCA’s leverage restrictions
You will not have the right to settle disputes via the Financial Ombudsman Service (FOS)
You will not be protected by Financial Services Compensation Scheme (FSCS)
Any monies deposited will not be afforded the protection required under the FCA Client Assets Sourcebook. The level of protection for your funds will be determined by the regulations of the relevant local regulator.
Note: UK clients are kindly invited to visit https://www.ultima-markets.co.uk/. Ultima Markets UK expects to begin onboarding UK clients in accordance with FCA regulatory requirements in 2026.
If you would like to proceed and visit this website, you acknowledge and confirm the following:
1.The website is owned by Ultima Markets’ international entities and not by Ultima Markets UK Ltd, which is regulated by the FCA.
2.Ultima Markets Limited, or any of the Ultima Markets international entities, are neither based in the UK nor licensed by the FCA.
3.You are accessing the website at your own initiative and have not been solicited by Ultima Markets Limited in any way.
4.Investing through this website does not grant you the protections provided by the FCA.
5.Should you choose to invest through this website or with any of the international Ultima Markets entities, you will be subject to the rules and regulations of the relevant international regulatory authorities, not the FCA.
Ultima Markets wants to make it clear that we are duly licensed and authorised to offer the services and financial derivative products listed on our website. Individuals accessing this website and registering a trading account do so entirely of their own volition and without prior solicitation.
By confirming your decision to proceed with entering the website, you hereby affirm that this decision was solely initiated by you, and no solicitation has been made by any Ultima Markets entity.
Learn the symmetrical triangle pattern, how traders identify breakouts, calculate price targets and apply this chart pattern in forex trading strategies.
Markets do not always move in a clear direction. Before a major price movement, assets often enter a period where buyers and sellers compete for control, causing price volatility to gradually decrease. This is where the symmetrical triangle pattern becomes a valuable tool for traders.
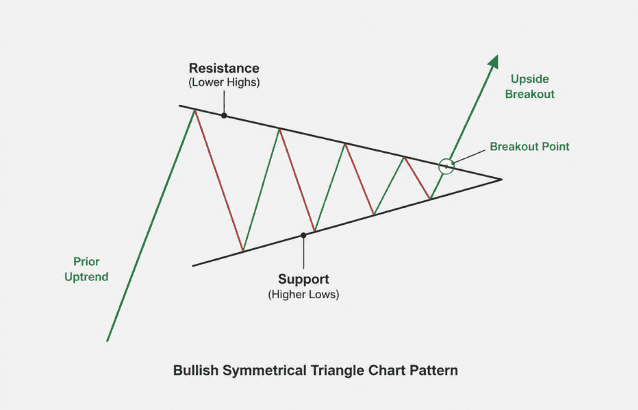
The symmetrical triangle pattern is a technical analysis chart formation that shows a period of market consolidation through a series of lower highs and higher lows. As price movements become narrower, two trendlines converge towards each other, creating a triangle shape on the chart. This compression often signals that the market is approaching a potential breakout.
Unlike ascending or descending triangles, the symmetrical triangle pattern does not have a clear bullish or bearish bias before the breakout. Instead, traders use it to prepare for increased volatility and identify potential opportunities once price confirms a direction.
What Is a Symmetrical Triangle Pattern?
A symmetrical triangle pattern forms when an asset’s price moves within a narrowing range.
The pattern consists of two trendlines:
Upper trendline: connects a series of lower highs, showing that sellers are limiting upward price movements.
Lower trendline: connects a series of higher lows, showing that buyers are stepping in at increasingly higher levels.
As these two trendlines move closer together, the market enters a consolidation phase where neither buyers nor sellers have full control. This creates a balance between supply and demand before one side eventually pushes price beyond the pattern.
The symmetrical triangle is often considered a continuation pattern because it frequently appears during an existing trend before the previous direction resumes. However, traders should not assume the outcome because breakouts can happen in either direction.
How Does a Symmetrical Triangle Pattern Form?
The formation process reflects changing market psychology.
At the beginning of the pattern, price usually experiences stronger movements. Buyers push the market higher while sellers create resistance. Over time, each attempt to extend the trend becomes weaker.
This creates:
Lower peaks as buying pressure slows
Higher bottoms as selling pressure weakens
Reduced volatility as the trading range contracts
A valid symmetrical triangle pattern normally contains at least two lower highs and two higher lows connected by converging trendlines. Many traders look for additional touches because repeated reactions at these levels can strengthen the pattern’s validity.
The narrowing price range represents a market “compression” phase. Similar to a coiled spring, the longer price remains within the structure, the more traders watch for a possible expansion in volatility.
Key Characteristics of a Symmetrical Triangle Pattern
1. Converging Trendlines
The defining feature of the pattern is the meeting point between the upper and lower trendlines, known as the apex.
The upper trendline slopes downward, while the lower trendline slopes upward. Their convergence shows that the difference between buying and selling pressure is becoming smaller.
2. Declining Volatility
As the pattern develops, price movements usually become smaller.
This decline in volatility indicates market hesitation. Traders are waiting for a catalyst that could determine the next major move.
3. Breakout Confirmation
The pattern is not considered complete until price breaks outside one of the trendlines.
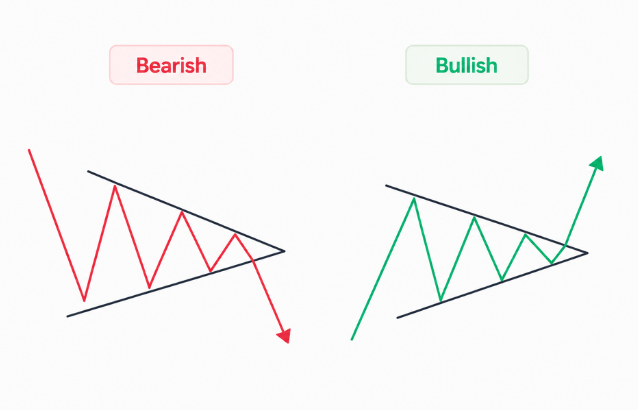
A bullish breakout occurs when price moves above the upper resistance line.
A bearish breakout occurs when price falls below the lower support line.
Because symmetrical triangles can break in either direction, traders usually wait for confirmation rather than predicting the outcome.
How to Trade the Symmetrical Triangle Pattern
Trading the symmetrical triangle pattern requires patience because entering too early can lead to losses from false breakouts.
Step 1: Identify the Setup
First, traders look for:
A narrowing price range
Lower highs and higher lows
Two converging trendlines
The pattern can appear on different markets, including forex, commodities, indices, stocks, and cryptocurrencies.
Step 2: Wait for a Confirmed Breakout
A breakout confirmation may include:
A strong candle closing outside the triangle
Increased trading volume
Momentum indicators supporting the direction
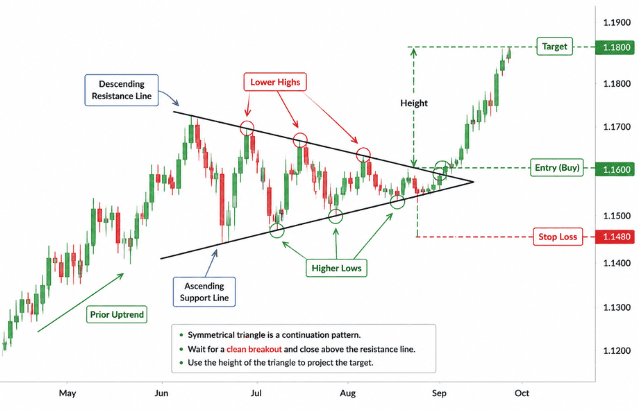
For example, if EUR/USD breaks above the upper trendline with stronger momentum, traders may interpret this as a possible continuation of the previous bullish trend.
However, if price breaks below support, it may indicate increasing selling pressure.
Step 3: Manage Risk
No chart pattern guarantees a successful trade. Traders should always consider risk management.
Common approaches include:
Placing a stop loss below the breakout level for bullish trades
Placing a stop loss above the breakout level for bearish trades
Adjusting position size based on risk tolerance
How to Calculate a Symmetrical Triangle Price Target
One popular method for estimating a potential target is the measured move technique.
Traders measure the widest distance between the highest and lowest points of the triangle and apply that distance from the breakout point.
Example:
Highest point of triangle: 1.1000
Lowest point of triangle: 1.0800
Pattern height: 200 pips
If EUR/USD breaks upward at 1.0950:
Potential target:
1.0950 + 200 pips = 1.1150
For a bearish breakout:
1.0950 – 200 pips = 1.0750
This target is only a projection. Market conditions, economic events, and momentum can cause price to move further or reverse before reaching the estimated level.
Common Mistakes When Trading Symmetrical Triangle Patterns
Entering Before Confirmation
A common mistake is assuming the breakout direction before it happens.
Since the symmetrical triangle pattern is neutral, price may move higher or lower depending on market conditions.
Ignoring False Breakouts
Sometimes price briefly moves outside the triangle before returning inside the previous range.
To reduce the risk of false signals, traders often wait for:
Candle confirmation
Momentum support
A possible retest of the broken trendline
Using the Pattern Alone
Technical patterns work best when combined with other analysis tools.
Many traders use indicators such as:
RSI to measure momentum
MACD to identify trend strength
Moving averages to confirm market direction
Symmetrical Triangle vs Other Triangle Patterns
Pattern
Structure
Typical Bias
Symmetrical Triangle
Lower highs and higher lows
Neutral
Ascending Triangle
Rising support with flat resistance
Usually bullish
Descending Triangle
Falling resistance with flat support
Usually bearish
The main difference is that symmetrical triangles do not provide a directional signal until the breakout occurs.
Best Timeframe for Trading Symmetrical Triangle Patterns
The symmetrical triangle pattern can appear on any timeframe, but higher timeframes generally provide stronger signals because they contain less market noise.
Common uses include:
5-minute to 15-minute charts: Short-term trading opportunities
1-hour to 4-hour charts: Intraday forex setups
Daily and weekly charts: Longer-term trend analysis
A pattern that develops over several weeks usually attracts more attention than one forming within a few hours because it represents a longer period of market uncertainty.
Conclusion
The symmetrical triangle reflects a battle between buyers and sellers.
Initially, buyers and sellers push price aggressively. However, as the pattern develops, both sides lose momentum.
Buyers become less willing to pay higher prices, while sellers become less aggressive in pushing prices lower.
Eventually, one side gains enough strength to break the balance, creating a new market direction.
Understanding this psychology helps traders see the pattern as more than just a shape on a chart. It represents changing sentiment and market expectations.
FAQs
Is a symmetrical triangle pattern bullish or bearish?
A symmetrical triangle pattern is considered a neutral chart pattern because it does not indicate a bullish or bearish direction before the breakout. The price can move above the upper trendline for a bullish breakout or below the lower trendline for a bearish breakout. Traders usually wait for confirmation before entering a position.
What does a symmetrical triangle pattern mean in forex?
In forex trading, a symmetrical triangle pattern represents a period of market consolidation where buyers and sellers are temporarily balanced. The pattern shows decreasing volatility as the price forms lower highs and higher lows. A breakout from the pattern may signal the start of a new trend or continuation of the existing market direction.
Which triangle pattern is bullish?
The ascending triangle pattern is generally considered the most bullish triangle pattern. It forms when price creates higher lows while repeatedly testing a horizontal resistance level. A breakout above resistance may indicate increasing buying pressure. However, traders should still confirm the breakout with momentum and market conditions.
What is the target of the symmetrical triangle pattern?
The target of a symmetrical triangle pattern is commonly estimated using the measured move method. Traders measure the height of the widest part of the triangle and apply that distance from the breakout point. For example, if the triangle measures 200 pips in height, traders may project a potential 200-pip move after the breakout.
Share Now
Disclaimer:This content is provided for informational purposes only and does not constitute, and should not be construed as, financial, investment, or other professional advice. No statement or opinion contained herein should be considered a recommendation by Ultima Markets or the author regarding any specific investment product, strategy, or transaction. Readers are advised not to rely solely on this material when making investment decisions and should seek independent advice where appropriate.
Thank you for visiting the Ultima Markets website. Please note that this website is intended for individuals residing in jurisdictions where access is permitted by law. Ultima and its affiliated entities do not operate in your home jurisdiction.
By clicking ‘Acknowledge’, you confirm that you are entering this website solely on your own initiative and not as a result of any specific marketing outreach. You wish to obtain information from this website based on reverse solicitation principles, in accordance with the applicable laws of your home jurisdiction.