This website is managed by Ultima Markets’ international entities, and it’s important to emphasise that they are not subject to regulation by the FCA in the UK. Therefore, you must understand that you will not have the FCA’s protection when investing through this website – for example:
You will not be guaranteed Negative Balance Protection
You will not be protected by FCA’s leverage restrictions
You will not have the right to settle disputes via the Financial Ombudsman Service (FOS)
You will not be protected by Financial Services Compensation Scheme (FSCS)
Any monies deposited will not be afforded the protection required under the FCA Client Assets Sourcebook. The level of protection for your funds will be determined by the regulations of the relevant local regulator.
Note: UK clients are kindly invited to visit https://www.ultima-markets.co.uk/. Ultima Markets UK expects to begin onboarding UK clients in accordance with FCA regulatory requirements in 2026.
If you would like to proceed and visit this website, you acknowledge and confirm the following:
1.The website is owned by Ultima Markets’ international entities and not by Ultima Markets UK Ltd, which is regulated by the FCA.
2.Ultima Markets Limited, or any of the Ultima Markets international entities, are neither based in the UK nor licensed by the FCA.
3.You are accessing the website at your own initiative and have not been solicited by Ultima Markets Limited in any way.
4.Investing through this website does not grant you the protections provided by the FCA.
5.Should you choose to invest through this website or with any of the international Ultima Markets entities, you will be subject to the rules and regulations of the relevant international regulatory authorities, not the FCA.
Ultima Markets wants to make it clear that we are duly licensed and authorised to offer the services and financial derivative products listed on our website. Individuals accessing this website and registering a trading account do so entirely of their own volition and without prior solicitation.
By confirming your decision to proceed with entering the website, you hereby affirm that this decision was solely initiated by you, and no solicitation has been made by any Ultima Markets entity.
Learn how to identify and trade the broadening wedge pattern in technical analysis. Discover its formation, breakout strategies, and tips for trading it.
The Broadening Wedge Pattern Explained
The broadening wedge pattern is one of the most distinctive and dynamic chart formations in technical analysis. Unlike contracting patterns such as triangles or traditional wedges, this pattern expands over time, signaling increasing volatility, indecision, and potential for significant breakouts.
Whether you’re trading stocks, forex, crypto, or commodities, understanding this pattern can help you navigate complex price action and improve trade timing.
What Is the Broadening Wedge Pattern?
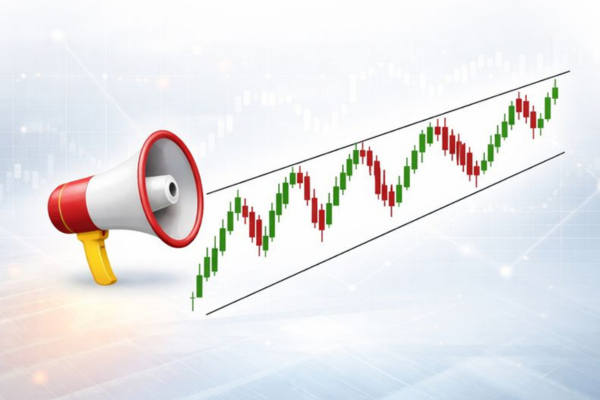
A broadening wedge, also known as a megaphone pattern, is formed when price movements become increasingly volatile, with higher highs and lower lows creating two diverging trendlines. These trendlines visually represent the market’s growing indecision and expansion in price range.
Unlike patterns like triangles or flags that contract, the broadening wedge expands, making it an important signal for traders to recognize the potential for major price moves in either direction.
The pattern typically appears after a period of consolidation, where the market is indecisive and struggling to form a clear trend. As price oscillates between higher highs and lower lows, the range between the swings continues to widen, creating the distinct wedge shape.
How It Differs From Other Wedges
Traditional rising or falling wedges narrow over time and are typically interpreted as reversal patterns. In contrast:
Broadening wedges expand outwards
They can appear in uptrends and downtrends
They are considered bilateral, meaning the breakout direction is unpredictable without confirmation
Bullish and Bearish Broadening Wedge Pattern
There are two major variations:
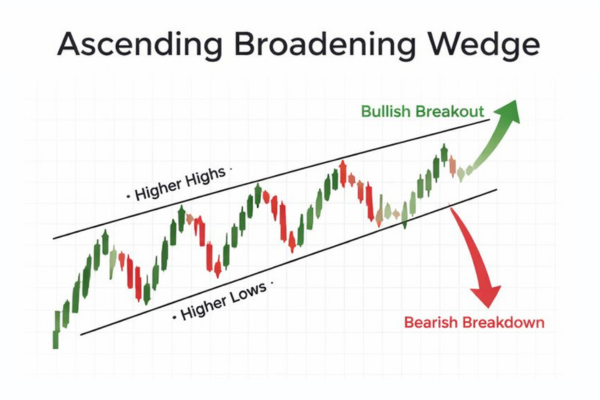
1. Ascending Broadening Wedge
Both trendlines slope upward as price widens between them.
Despite the upward tilt, historical data shows bearish breakouts occur more often than bullish ones in this setup.
Bulkowski’s analysis suggests downward breaks may occur ~58% of the time, whereas upward breaks occur ~42%.
2. Descending Broadening Wedge Pattern
Both trendlines slope downward with expanding swings.
Interestingly, this pattern often signals bullish reversals, with upward breakouts slightly more common. This is about 54% of instances and average post-break rises around 34%.
Market Psychology Behind the Pattern
The hallmark of a broadening wedge is escalating uncertainty:
Price swings grow wider. Buyers push to new highs while sellers drive deeper lows
Neither side maintains control, creating chaos and heightened volatility
This tug-of-war suggests smart money may be reducing positions while retail traders chase movements, sometimes leading to exhaustion ahead of a breakout
Statistical Reliability & Breakout Probabilities
While broadening wedges are powerful, they’re inherently less directional compared to other patterns:
Metric
Typical Broadening Formation
Upward break frequency
~49%
Downward break frequency
~51%
Average post-break move
~20% (either direction)
Failure / false breakout rate
~18%
Pullback/throwback frequency
~66%
These stats suggest the pattern is neutral overall, meaning successful trading relies heavily on confirmation techniques rather than pattern recognition alone.
Entry & Exit Strategies
1. Wait for Breakout Confirmation
Don’t trade the pattern itself. Trade the breakout:
Break above resistance line → Consider long entry
Break below support line → Consider short entry
Volume increase at breakout adds confirmation strength
2. Use Stop-Loss and Targets
Place stop-loss just beyond the last swing opposite your position
Use the height of the pattern projected from breakout as a price target
3. Multi-Timeframe Confirmation
A pattern visible on multiple timeframes (e.g., 4H + daily) is statistically more reliable than one only on a single timeframe.
Common Mistakes to Avoid
Jumping in Too Early: One of the biggest mistakes traders make with the broadening wedge is entering the market before the breakout is confirmed. The price can often retrace or break out in the wrong direction, leaving premature traders trapped in unfavorable positions.
Ignoring Volume: Volume is a critical component of confirming the breakout. Traders should not enter a position unless they see a noticeable surge in volume during the breakout. A breakout without volume is often a false signal.
Trading Without Context: The broadening wedge should not be the only pattern used for trading decisions. Always consider the broader market trend, key economic events, and other technical indicators to ensure that your decision aligns with the overall market sentiment.
Recent Market Example: Bitcoin Breakout
An example from October 2024 showed Bitcoin breaking out of a descending broadening wedge after ~7 months of action. The breakout was followed by a strong retest and continuation upward, illustrating real-world validity of reversal signals from this pattern.
Integrating the Pattern With Other Tools
To improve accuracy:
RSI & MACD: help confirm momentum behind breakouts
Volume Analysis: spikes often accompany genuine breakouts
Trend Context: patterns forming at significant highs or lows carry more weight
Final Thoughts
The broadening wedge pattern is a versatile and visually distinctive chart formation that highlights volatility and market indecision. While it doesn’t inherently predict direction, its expanding structure often precedes powerful breakouts. The key to success lies in patience, confirmation-based entry, and disciplined risk management.
When blended with complementary tools and validated through multi-timeframe signals, the broadening wedge can be an effective part of a modern trading strategy.
FAQ
What is a broadening wedge pattern in trading?
A broadening wedge pattern is a chart formation where price swings widen over time, creating diverging trendlines. It signals increased volatility and potential breakout opportunities in either direction.
How can I identify a broadening wedge pattern on a chart?
To identify a broadening wedge, look for at least five price swings, where the highs and lows progressively widen. Two trendlines should connect the higher highs and lower lows, forming a megaphone shape.
What does a breakout from a broadening wedge pattern indicate?
A breakout from a broadening wedge pattern, either above the upper trendline or below the lower trendline, signals a potential price move in the breakout direction. Confirmation with volume and momentum is crucial for successful trading.
Share Now
Disclaimer:This content is provided for informational purposes only and does not constitute, and should not be construed as, financial, investment, or other professional advice. No statement or opinion contained herein should be considered a recommendation by Ultima Markets or the author regarding any specific investment product, strategy, or transaction. Readers are advised not to rely solely on this material when making investment decisions and should seek independent advice where appropriate.
Thank you for visiting the Ultima Markets website. Please note that this website is intended for individuals residing in jurisdictions where access is permitted by law. Ultima and its affiliated entities do not operate in your home jurisdiction.
By clicking ‘Acknowledge’, you confirm that you are entering this website solely on your own initiative and not as a result of any specific marketing outreach. You wish to obtain information from this website based on reverse solicitation principles, in accordance with the applicable laws of your home jurisdiction.