This website is managed by Ultima Markets’ international entities, and it’s important to emphasise that they are not subject to regulation by the FCA in the UK. Therefore, you must understand that you will not have the FCA’s protection when investing through this website – for example:
You will not be guaranteed Negative Balance Protection
You will not be protected by FCA’s leverage restrictions
You will not have the right to settle disputes via the Financial Ombudsman Service (FOS)
You will not be protected by Financial Services Compensation Scheme (FSCS)
Any monies deposited will not be afforded the protection required under the FCA Client Assets Sourcebook. The level of protection for your funds will be determined by the regulations of the relevant local regulator.
Note: UK clients are kindly invited to visit https://www.ultima-markets.co.uk/. Ultima Markets UK expects to begin onboarding UK clients in accordance with FCA regulatory requirements in 2026.
If you would like to proceed and visit this website, you acknowledge and confirm the following:
1.The website is owned by Ultima Markets’ international entities and not by Ultima Markets UK Ltd, which is regulated by the FCA.
2.Ultima Markets Limited, or any of the Ultima Markets international entities, are neither based in the UK nor licensed by the FCA.
3.You are accessing the website at your own initiative and have not been solicited by Ultima Markets Limited in any way.
4.Investing through this website does not grant you the protections provided by the FCA.
5.Should you choose to invest through this website or with any of the international Ultima Markets entities, you will be subject to the rules and regulations of the relevant international regulatory authorities, not the FCA.
Ultima Markets wants to make it clear that we are duly licensed and authorised to offer the services and financial derivative products listed on our website. Individuals accessing this website and registering a trading account do so entirely of their own volition and without prior solicitation.
By confirming your decision to proceed with entering the website, you hereby affirm that this decision was solely initiated by you, and no solicitation has been made by any Ultima Markets entity.
The bullish engulfing candle and the bearish engulfing candle are both patterns of the engulfing candle pattern that signals potential trend reversals.
Bullish and Bearish Engulfing Candle Patterns
In technical analysis, candlestick patterns play a crucial role in identifying price trends and potential reversals in the market. Among the most powerful and reliable candlestick patterns are the bullish engulfing candle and bearish engulfing candle. These patterns help traders anticipate shifts in market direction, making them valuable tools, particularly in volatile markets like forex.
In this article, we will explore what engulfing candlestick patterns are, how to identify them, and how to use them effectively in your trading strategy.
What is an Engulfing Candlestick Pattern?
An engulfing candlestick pattern is a simple yet powerful pattern that occurs when a candle’s real body fully engulfs the body of the previous candle. This shift in momentum indicates a potential reversal, signaling that buyers or sellers are taking control of the market.
There are two types of engulfing patterns:
Bullish Engulfing Candle: This occurs when a large green (bullish) candle fully engulfs a smaller red (bearish) candle, signaling a shift from bearish to bullish momentum.
Bearish Engulfing Candle: This occurs when a large red (bearish) candle fully engulfs a smaller green (bullish) candle, indicating a shift from bullish to bearish momentum.
While wicks (or shadows) may appear on the candles, they do not significantly affect the pattern’s validity. The focus is on the real body of the candlesticks, which represents the open-to-close range of each trading period. Engulfing patterns are particularly reliable when they occur at the end of a trend or during periods of strong market momentum shifts.
Key Takeaways:
The engulfing candle signals strong price action and potential trend reversals.
Bullish engulfing occurs at the end of a downtrend, and bearish engulfing occurs at the end of an uptrend.
They are more effective when combined with other technical indicators and support/resistance levels.
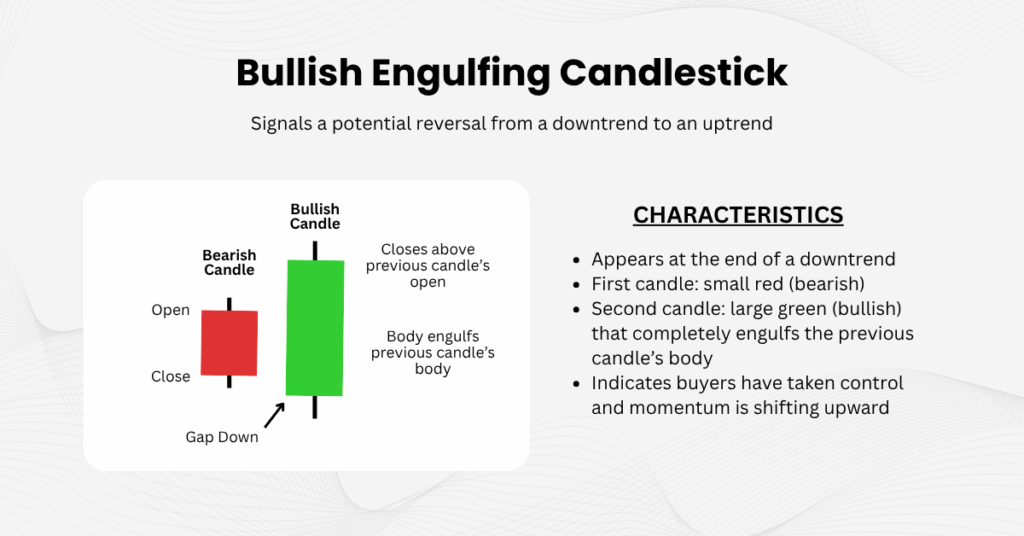
The Bullish Engulfing Candle
The bullish engulfing candle signals a potential reversal from downtrend to an uptrend. – Ultima Markets
A bullish engulfing candle occurs at the end of a downtrend. It consists of a smaller red candle, followed by a larger green candle that completely engulfs the first candle’s body. This suggests that buyers have gained control, and the market is likely to reverse to an uptrend.
Key Takeaways:
Characteristics
Description
Trend Context
Appears at the end of a downtrend, signaling a potential bullish reversal.
Market Sentiment
The pattern indicates that buyers are taking over, overpowering the previous bearish pressure.
Effective Entry
The bullish engulfing pattern is ideal for traders looking to go long or enter a buy position, particularly near support levels.
The bullish engulfing pattern is easy to spot and offers a strong reversal signal. Its effectiveness increases when it appears near key support levels, such as a recent low or Fibonacci retracement level. Additionally, the pattern becomes more reliable when confirmed by rising volume, indicating that buyers are serious about reversing the trend.
The Bearish Engulfing Candle
A bearish engulfing candle is the opposite of the bullish pattern. It occurs at the top of an uptrend, where a smaller green candle is followed by a larger red candle that completely engulfs the first candle’s body. This suggests that sellers have taken control and the market may reverse into a downtrend.
Key Takeaways:
Characteristics
Description
Trend Context
Appears at the end of an uptrend, signaling a potential bearish reversal.
Market Sentiment
The pattern indicates that sellers are taking over, pushing the market lower.
Effective Entry
The bearish engulfing pattern is ideal for traders looking to short-sell or enter a sell position, particularly near resistance levels.
Like the bullish engulfing pattern, the bearish engulfing candle is most reliable when it appears near key resistance levels, such as a previous swing high or a major trendline. Confirming the pattern with increased volume can enhance its reliability, suggesting that sellers are in control and the market is likely to decline further.
Trading the Engulfing Candle
How to Identify an Engulfing Candlestick Pattern
Spotting an engulfing candlestick pattern is straightforward once you understand the structure:
Look for two consecutive candles.
The first candle is typically small and reflects the prevailing trend.
The second candle must have a larger body that fully engulfs the body of the first candle.
In a bullish engulfing, the second candle is green and closes above the first candle’s open.
In a bearish engulfing, the second candle is red and closes below the first candle’s open.
It’s important to focus on the real bodies of the candles, as the wicks (shadows) are not as significant for the pattern. To confirm the pattern’s reliability, ensure it occurs in the right market context, such as at the end of a trend or near key support or resistance levels.
Tip to Note:
Volume Confirmation: High trading volume during the formation of the engulfing candle adds credibility to the pattern. For a bullish engulfing, rising volume suggests that buyers are serious about pushing the price higher. For a bearish engulfing, strong volume confirms that selling pressure is dominating.
Timeframes to Watch: Engulfing patterns are more reliable on higher timeframes like 1-hour, 4-hour, or daily charts. Lower timeframes (like 1- or 5-minute charts) can lead to false signals due to market noise. Higher timeframes offer a clearer picture of the trend.
How to Trade Engulfing Candlestick Patterns
Trading the engulfing candle involves more than just spotting the pattern; it’s about understanding when to enter, where to exit, and how to confirm the signal. Here’s how you can trade these patterns effectively:
Entry Signals:
For a bullish engulfing, enter a long position after the second green candle has fully engulfed the red candle, ideally near a support level.
For a bearish engulfing, enter a short position after the second red candle has engulfed the green candle, ideally near a resistance level.
Exit Signals:
Stop-Loss Placement: Place your stop-loss just below the low of the bullish engulfing candle (for long trades) or above the high of the bearish engulfing candle (for short trades).
Profit Targets: Set your profit target at recent swing highs (for bullish trades) or swing lows (for bearish trades). Alternatively, you can apply a risk-to-reward ratio (e.g., if your stop-loss is 20 pips, set your take-profit at 40 pips for a 1:2 ratio).
To reduce risk and protect profits, consider using trailing stops as the market moves in your favor.
Combining Indicators:
For enhanced accuracy, confirm engulfing patterns with other technical indicators:
RSI: Look for oversold conditions in bullish setups and overbought conditions in bearish setups.
MACD: Use MACD crossovers to align with the direction of the engulfing pattern.
Moving Averages: A bullish engulfing above a key moving average is a stronger signal, while a bearish engulfing below a moving average adds weight to the pattern.
Multi-Timeframe Strategy
To further improve the accuracy of your trade, apply a multi-timeframe strategy:
Use a higher timeframe (e.g., daily chart) to identify the overall trend.
Drop to a lower timeframe (e.g., 1-hour or 4-hour chart) to spot the engulfing pattern and refine your entry.
By aligning your trades with the broader market direction, you reduce the risk of being caught in short-term noise and increase your chances of success.
Conclusion
The bullish engulfing candle, bearish engulfing candle, and engulfing candlestick patterns are powerful tools for identifying potential trend reversals in the market. While they can offer strong signals, they are most effective when used in conjunction with other technical indicators, volume analysis, and support/resistance levels.
By understanding the context in which these patterns form and applying a multi-timeframe strategy, you can improve your trade accuracy and enhance your chances of success. Always use proper risk management and confirm your signals to avoid false breakouts and minimize losses.
Share Now
Disclaimer:This content is provided for informational purposes only and does not constitute, and should not be construed as, financial, investment, or other professional advice. No statement or opinion contained herein should be considered a recommendation by Ultima Markets or the author regarding any specific investment product, strategy, or transaction. Readers are advised not to rely solely on this material when making investment decisions and should seek independent advice where appropriate.
Thank you for visiting the Ultima Markets website. Please note that this website is intended for individuals residing in jurisdictions where access is permitted by law. Ultima and its affiliated entities do not operate in your home jurisdiction.
By clicking ‘Acknowledge’, you confirm that you are entering this website solely on your own initiative and not as a result of any specific marketing outreach. You wish to obtain information from this website based on reverse solicitation principles, in accordance with the applicable laws of your home jurisdiction.