This website is managed by Ultima Markets’ international entities, and it’s important to emphasise that they are not subject to regulation by the FCA in the UK. Therefore, you must understand that you will not have the FCA’s protection when investing through this website – for example:
You will not be guaranteed Negative Balance Protection
You will not be protected by FCA’s leverage restrictions
You will not have the right to settle disputes via the Financial Ombudsman Service (FOS)
You will not be protected by Financial Services Compensation Scheme (FSCS)
Any monies deposited will not be afforded the protection required under the FCA Client Assets Sourcebook. The level of protection for your funds will be determined by the regulations of the relevant local regulator.
Note: UK clients are kindly invited to visit https://www.ultima-markets.co.uk/. Ultima Markets UK expects to begin onboarding UK clients in accordance with FCA regulatory requirements in 2026.
If you would like to proceed and visit this website, you acknowledge and confirm the following:
1.The website is owned by Ultima Markets’ international entities and not by Ultima Markets UK Ltd, which is regulated by the FCA.
2.Ultima Markets Limited, or any of the Ultima Markets international entities, are neither based in the UK nor licensed by the FCA.
3.You are accessing the website at your own initiative and have not been solicited by Ultima Markets Limited in any way.
4.Investing through this website does not grant you the protections provided by the FCA.
5.Should you choose to invest through this website or with any of the international Ultima Markets entities, you will be subject to the rules and regulations of the relevant international regulatory authorities, not the FCA.
Ultima Markets wants to make it clear that we are duly licensed and authorised to offer the services and financial derivative products listed on our website. Individuals accessing this website and registering a trading account do so entirely of their own volition and without prior solicitation.
By confirming your decision to proceed with entering the website, you hereby affirm that this decision was solely initiated by you, and no solicitation has been made by any Ultima Markets entity.
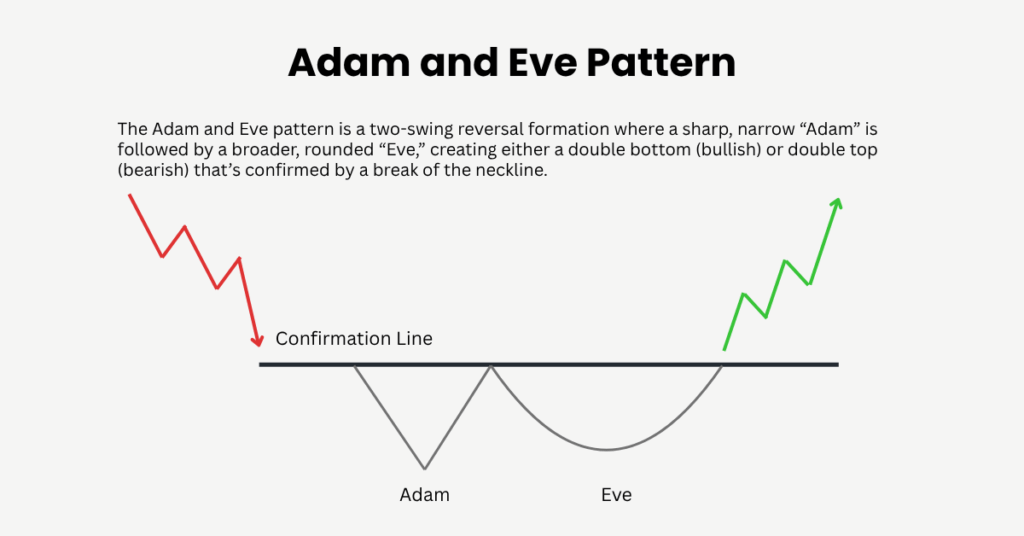
Understand the Adam and Eve pattern from setup to confirmation, see why it works, and learn simple rules to trade double bottoms and tops correctly.
A Guide on the Adam and Eve Pattern
The Adam and Eve pattern is a favourite among chart readers because it blends clear visual cues with straightforward trading rules. This article walks you through what the pattern is, how to spot it, and practical ways to trade both the bullish and bearish versions with sensible risk controls.
What Is the Adam and Eve Pattern?
At its core, the Adam and Eve pattern is a two-swing reversal. One swing is sharp and narrow which traders call Adam, while the other swing is rounded and wider which traders call Eve.
There are two ways this formation shows up on charts. When it forms at lows it is a double bottom that hints at a bullish reversal. When it forms at highs it is a double top that hints at a bearish reversal. Knowing which side you are looking at keeps the next steps clear.
Which Variant Traders See More
In trending markets traders often spot the double bottom variant more frequently because dips are bought and rounded retests develop naturally. During exhausted uptrends the double top becomes more visible as rallies fade and retests struggle. Use the broader market context to decide which version deserves your focus.
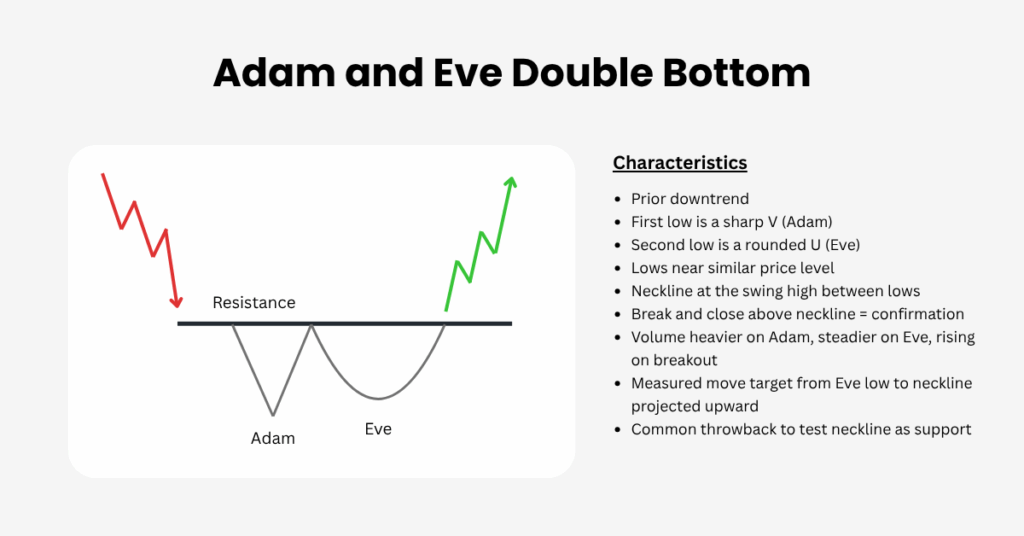
Adam and Eve Double Bottom
A double bottom version appears after a downtrend and hints at a bullish turn.
How to Identify It
After a clear decline, the pattern begins with a fast, V-shaped selloff and rebound that forms Adam, followed by a slower, rounded retest that forms Eve near a similar price level. Draw a neckline across the swing high between the two lows and watch how price behaves around it. The setup improves when volume is heavier during Adam, steadier through Eve, and begins to expand as price pushes toward the neckline. A decisive close above the neckline completes the pattern and shifts the bias to the upside.
How to Trade It
Many traders buy after a strong daily close above the neckline, while more cautious traders wait for a pullback to the neckline that holds as new support. The protective stop usually sits just below the Eve low, with a small volatility buffer if markets are noisy. For targets, measure the distance from the Eve low to the neckline and project that distance upward; taking partial profits at this level and trailing the remainder helps you stay involved if momentum extends.
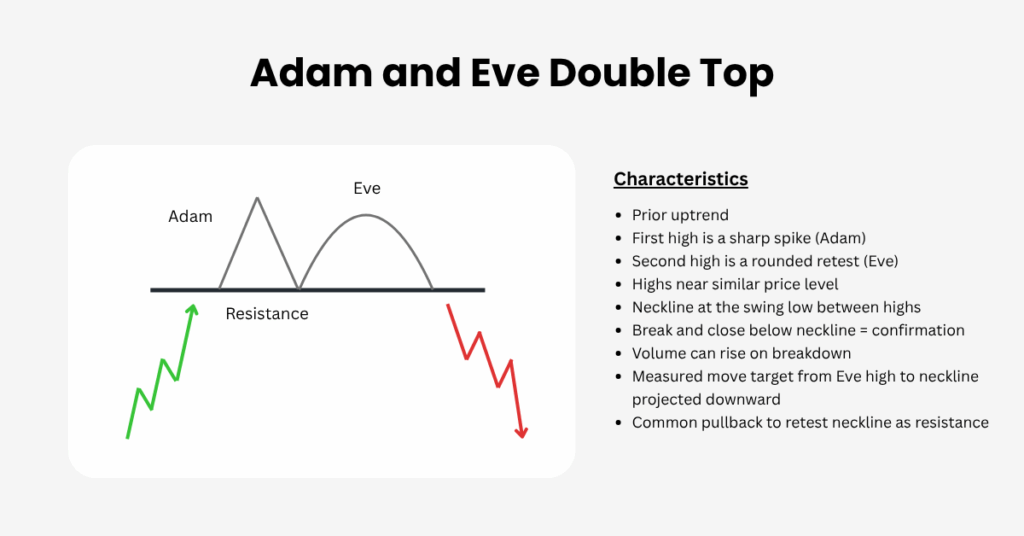
Adam and Eve Double Top
A double top version appears after an uptrend and hints at a bearish turn.
How to Identify It
In an established uptrend, look for a narrow spike high that quickly snaps back to form Adam, then a rounded retest that stalls near the same area to form Eve. Mark the neckline through the swing low between the two highs and monitor how price reacts as it approaches this level. The case strengthens when momentum fades during Eve and volume begins to pick up on pushes down toward the neckline. A firm close below the neckline confirms the bearish turn.
How to Trade It
Short entries often follow a clean daily close under the neckline, though some traders prefer to wait for a rebound that fails at the neckline, showing it has flipped to resistance. Place the stop just above the Eve high with a modest buffer to account for volatility. Set the initial objective by measuring the distance from the Eve high to the neckline and projecting it downward; scale out at that target and trail the rest to capture any follow-through.
Simple Confirmations
In order to ensure that this pattern is working correctly, you should use a few indicators to confirm before taking any next steps.
Momentum shift such as RSI moving above 50 on a completed bottom or below 50 on a completed top
A 50 period moving average starting to curl in the new direction
Volume expanding as price breaks the neckline
Risk Management That Fits The Setup
Patterns are probabilities, not promises. Keep risk small and consistent.
Use fixed fractional risk per trade
Give trades room for a throwback to the neckline instead of placing stops exactly on obvious levels
Pre plan partial exits at the measured move and let a trailing stop manage the rest
Common Mistakes
A few simple checks help you avoid avoidable losses.
Entering before the neckline break
Calling any two swings Adam and Eve without the distinct V then U tempo
Ignoring higher timeframe levels that sit right beyond the neckline
Trading straight into major news that can overwhelm the setup
Frequently Asked Questions
Which timeframe works best The pattern appears on intraday to weekly charts. Higher timeframes such as four hour and daily tend to be cleaner and less noisy.
Does it work on forex, stocks, crypto, and commodities Yes. The logic is about crowd behaviour rather than a specific asset class.
Is the Adam and Eve pattern better than a classic double bottom Many traders prefer Adam and Eve because the contrasting shapes offer extra information about emotion and participation. In practice, treat it as one more high quality reversal tool, not a guarantee.
Key Takeaways
The Adam and Eve pattern pairs a sharp swing with a rounded retest to flag a potential reversal. Wait for a clear neckline break, place stops where the idea is proven wrong, and use measured-move targets with partial exits. Keep the chart clean, respect the broader trend and news context, and let risk management do the heavy lifting.
Share Now
Disclaimer:This content is provided for informational purposes only and does not constitute, and should not be construed as, financial, investment, or other professional advice. No statement or opinion contained herein should be considered a recommendation by Ultima Markets or the author regarding any specific investment product, strategy, or transaction. Readers are advised not to rely solely on this material when making investment decisions and should seek independent advice where appropriate.
Thank you for visiting the Ultima Markets website. Please note that this website is intended for individuals residing in jurisdictions where access is permitted by law. Ultima and its affiliated entities do not operate in your home jurisdiction.
By clicking ‘Acknowledge’, you confirm that you are entering this website solely on your own initiative and not as a result of any specific marketing outreach. You wish to obtain information from this website based on reverse solicitation principles, in accordance with the applicable laws of your home jurisdiction.