This website is managed by Ultima Markets’ international entities, and it’s important to emphasise that they are not subject to regulation by the FCA in the UK. Therefore, you must understand that you will not have the FCA’s protection when investing through this website – for example:
You will not be guaranteed Negative Balance Protection
You will not be protected by FCA’s leverage restrictions
You will not have the right to settle disputes via the Financial Ombudsman Service (FOS)
You will not be protected by Financial Services Compensation Scheme (FSCS)
Any monies deposited will not be afforded the protection required under the FCA Client Assets Sourcebook. The level of protection for your funds will be determined by the regulations of the relevant local regulator.
Note: UK clients are kindly invited to visit https://www.ultima-markets.co.uk/. Ultima Markets UK expects to begin onboarding UK clients in accordance with FCA regulatory requirements in 2026.
If you would like to proceed and visit this website, you acknowledge and confirm the following:
1.The website is owned by Ultima Markets’ international entities and not by Ultima Markets UK Ltd, which is regulated by the FCA.
2.Ultima Markets Limited, or any of the Ultima Markets international entities, are neither based in the UK nor licensed by the FCA.
3.You are accessing the website at your own initiative and have not been solicited by Ultima Markets Limited in any way.
4.Investing through this website does not grant you the protections provided by the FCA.
5.Should you choose to invest through this website or with any of the international Ultima Markets entities, you will be subject to the rules and regulations of the relevant international regulatory authorities, not the FCA.
Ultima Markets wants to make it clear that we are duly licensed and authorised to offer the services and financial derivative products listed on our website. Individuals accessing this website and registering a trading account do so entirely of their own volition and without prior solicitation.
By confirming your decision to proceed with entering the website, you hereby affirm that this decision was solely initiated by you, and no solicitation has been made by any Ultima Markets entity.
Overbought vs oversold made simple. Understand RSI levels, use Bands for context, and follow a clear plan to time pullbacks, protect and your capital.
Differentiating Overbought vs Oversold
Markets often look strongest just before they pause and weakest just before they base. Understanding overbought vs oversold helps you recognise those stretched moments without blindly fighting the trend. This guide explains what the terms mean, how popular tools measure them, why extremes form in the first place, and how to turn signals into actionable, risk-defined trades.
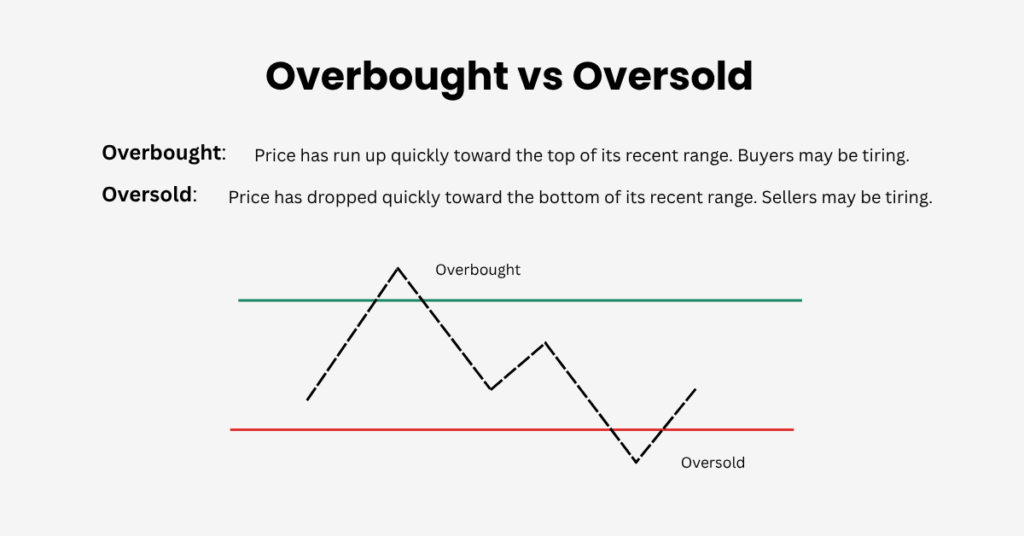
What Overbought vs Oversold Mean
Before you jump into indicators, anchor the idea in plain language. Think of overbought vs oversold as a quick check on whether price has sprinted too far in one direction.
Overbought describes a market that has risen quickly to the top of its recent range. Buyers may be getting exhausted. Oversold is the mirror image. Rapid drops toward the bottom of the range suggest sellers may be tiring. It is important to remember that these are conditions, not commands. In strong trends, prices can remain “extreme” longer than you expect. Treat the label as context and wait for price confirmation.
Don’t confuse overbought/oversold (a technical stretch) with overvalued/undervalued (a fundamental judgement based on earnings, cash flows, etc.). Technical extremes say how stretched momentum is, not what a business is worth.
Why Extremes Happen
Overbought and oversold often start with human behaviour. When crowds get excited about good news or fearful on bad news, prices can move too far, too fast. Headlines, rumours, earnings surprises, and shocks all fuel these rushes. Indicators don’t predict the news; they quantify how intense the rush has been so you can decide whether momentum is likely to pause, continue, or mean-revert.
How Popular Indicators Flag Extremes
RSI (Relative Strength Index)
RSI measures the speed of recent gains versus losses on a 0–100 scale. Readings above 70 commonly flag overbought, below 30 oversold. Use those as a starting point, not absolute rules. In uptrends, RSI often lives in a 40–80 “bull range”; in downtrends, a 20–60 “bear range.” In other words, an RSI near 70 during a healthy uptrend can be normal strength, not an automatic short.
Actionable tip:
Uptrend: watch RSI pullbacks to 40–45 that turn up near support.
Downtrend: watch RSI rallies to 50–60 that roll over near resistance.
Stochastic Oscillator
Stochastic compares the close to the recent high–low range. 80–100 is often labelled overbought and 0–20 oversold. It’s sensitive and shines in range-bound markets. In trends, demand extra confirmation such as a cross back out of the zone at a level that matters.
MFI (Money Flow Index)
MFI is a volume-weighted RSI. Extremes above 80 or below 20 matter, but the bigger edge is divergence. Price makes a new high while MFI fails, or price makes a new low while MFI holds up. Volume-aware momentum can filter traps.
CCI (Commodity Channel Index)
CCI gauges how far price is from its mean. Readings beyond +100/−100 flag stretch. In trends, dips toward −100 that turn up (or rallies toward +100 that turn down) can give elegant continuation entries.
Bollinger Bands
Bands plot standard deviations around a moving average. A tag of the upper band is not automatically “overbought.” Often, it simply confirms trend strength. The cleaner reversion clue is a close back inside the band or a momentum roll-over at prior structure.
A Simple Way To Use Them Together
Bringing RSI and Bands together keeps your process consistent. Use a moving average to define trend, then use RSI/Bands to time entries.
Find the trend with a single moving average like the 50 day.
Time entries with RSI and Bands.
In an uptrend, look for RSI to pull back toward 40 to 45, then turn up as price closes back above the mid band.
In a downtrend, look for RSI to rally toward 50 to 60, then roll over as price closes back inside the upper band.
Enter on confirmation, not on the raw extreme.
Place a stop beyond the recent swing.
Take profit at the next clear level or when RSI returns to the upper part of its range.
When News Drives Extremes
Story-driven moves behave differently. The first extreme usually flags risk, not an immediate reversal. Use these examples as a mental checklist.
Earnings gap ups and positive guidance can push RSI above 80 and keep it there while the story plays out. Treat the first extreme as a risk flag, not an automatic short.
Bad headlines or regulatory shocks can push RSI below 30. If the company is still sound, wait for a small higher low or a close back above the 20 day to stage in with defined risk.
One Starter Playbook
If you only try one setup, make it this. It teaches patience, confirmation, and risk control.
Trend Pullback Reentry
Context: Price is above the 50 day and making higher highs and higher lows.
Watch: RSI dips to about 40 to 45 while price touches the mid band.
Trigger: A strong close back above the prior day high.
Risk: Stop below the pullback low.
Exit: Prior high or when RSI revisits about 70 to 75.
Common Mistakes To Avoid
It’s easy to misuse overbought vs oversold when you’re new. These quick fixes keep you out of trouble.
Fighting every extreme. First check the higher timeframe trend.
Assuming a band tag equals reversal. Wait for the close back inside the bands.
Ignoring timeframe. Match your signals to your holding period. A daily oversold can coexist with an hourly overbought.
No plan for risk. Decide your stop and size before you click buy or sell.
Quick FAQs
Is overbought always bearish and oversold always bullish? No. They highlight stretch. You still need confirmation.
Which indicator is best for beginners Use RSI for momentum and Bollinger Bands for context. Add a simple moving average to see the trend.
What settings should I use Start with RSI 14 and Bollinger 20 with 2 standard deviations. Keep it simple and practice.
Share Now
Disclaimer:This content is provided for informational purposes only and does not constitute, and should not be construed as, financial, investment, or other professional advice. No statement or opinion contained herein should be considered a recommendation by Ultima Markets or the author regarding any specific investment product, strategy, or transaction. Readers are advised not to rely solely on this material when making investment decisions and should seek independent advice where appropriate.
Thank you for visiting the Ultima Markets website. Please note that this website is intended for individuals residing in jurisdictions where access is permitted by law. Ultima and its affiliated entities do not operate in your home jurisdiction.
By clicking ‘Acknowledge’, you confirm that you are entering this website solely on your own initiative and not as a result of any specific marketing outreach. You wish to obtain information from this website based on reverse solicitation principles, in accordance with the applicable laws of your home jurisdiction.