This website is managed by Ultima Markets’ international entities, and it’s important to emphasise that they are not subject to regulation by the FCA in the UK. Therefore, you must understand that you will not have the FCA’s protection when investing through this website – for example:
You will not be guaranteed Negative Balance Protection
You will not be protected by FCA’s leverage restrictions
You will not have the right to settle disputes via the Financial Ombudsman Service (FOS)
You will not be protected by Financial Services Compensation Scheme (FSCS)
Any monies deposited will not be afforded the protection required under the FCA Client Assets Sourcebook. The level of protection for your funds will be determined by the regulations of the relevant local regulator.
Note: UK clients are kindly invited to visit https://www.ultima-markets.co.uk/. Ultima Markets UK expects to begin onboarding UK clients in accordance with FCA regulatory requirements in 2026.
If you would like to proceed and visit this website, you acknowledge and confirm the following:
1.The website is owned by Ultima Markets’ international entities and not by Ultima Markets UK Ltd, which is regulated by the FCA.
2.Ultima Markets Limited, or any of the Ultima Markets international entities, are neither based in the UK nor licensed by the FCA.
3.You are accessing the website at your own initiative and have not been solicited by Ultima Markets Limited in any way.
4.Investing through this website does not grant you the protections provided by the FCA.
5.Should you choose to invest through this website or with any of the international Ultima Markets entities, you will be subject to the rules and regulations of the relevant international regulatory authorities, not the FCA.
Ultima Markets wants to make it clear that we are duly licensed and authorised to offer the services and financial derivative products listed on our website. Individuals accessing this website and registering a trading account do so entirely of their own volition and without prior solicitation.
By confirming your decision to proceed with entering the website, you hereby affirm that this decision was solely initiated by you, and no solicitation has been made by any Ultima Markets entity.
The hammer candlestick is one of the most common reversal signals. Learn what this pattern is and how to trade it with clear confirmation and risk control.
Trading the Hammer Candlestick Pattern
Markets rise and fall on shifts in sentiment. Sometimes you can see that shift forming inside a single candle. The hammer candlestick pattern is one of the clearest signs that selling pressure may be fading and buyers are stepping back in.
In the sections that follow, we will outline what a hammer looks like, where it tends to matter on the chart, and a simple way traders approach it. Quick, clear, and practical so you can spot it with confidence.
What Is A Hammer Candlestick
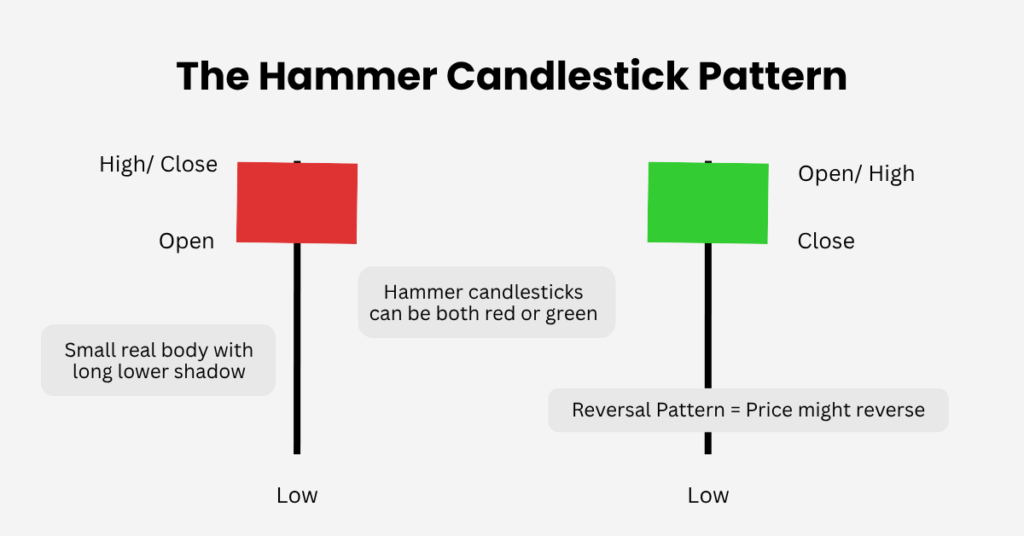
A hammer candlestick is a single candle with a small real body near the top of its range, a long lower shadow, and little or no upper shadow. It usually forms after a decline or during a counter-trend pullback. Sellers push price down, buyers absorb that pressure, and the close finishes back near the highs. Treat it as bullish context, not an automatic buy.
Quick Identification Rules
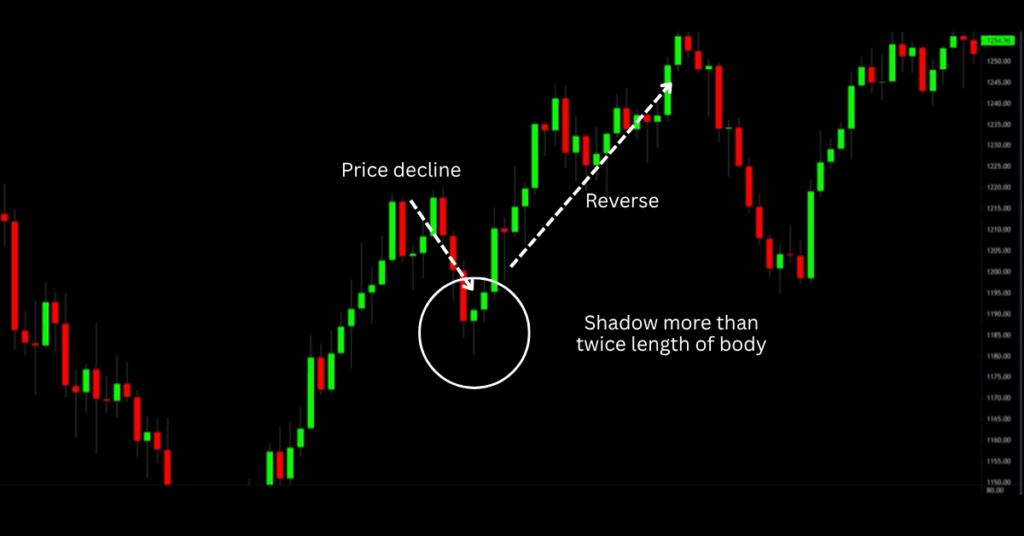
Lower shadow is at least two times the candle body
Body sits near the top of the range
Minimal or no upper shadow
Appears after a down move or a pullback
Remember that a hammer can be green or red. A green close is a small positive because buyers held the close, but both are valid as long as the shadow and context fit.
Why The Hammer Candlestick Matters
Markets turn when the balance of orders shifts. A hammer often signals that shift.
Exhaustion of selling Price probes lower and meets demand
Failed breakdown Bears cannot keep price below support
Momentum pause The close near the highs hints at stabilising forces
These clues become more useful when the hammer forms at clear technical levels such as prior swing lows, a demand zone, a trendline, or a well-watched moving average.
Hammer Candlestick Context And Confluence
Before you trade any candlestick, anchor it in the bigger picture.
Trend In an uptrend, a hammer during a pullback can be a continuation clue
Levels Reliability rises at established support or Fibonacci retracement zones
Timeframe Signals are cleaner from H1 and higher. Lower timeframes need stronger filters
Events and liquidity Major data or policy events can create gaps and slippage. Around those times, demand stronger confirmation and reduce size
It’s important to remember that a hammer must follow a decline. If price has moved sideways with no prior drop, the shape may fit but the context is weak.
Valid Versus Weak Hammers
Stronger Hammers
Long lower shadow into or through known support
Close in the upper quarter of the candle range
Next candle closes higher or breaks the hammer high
Volume expansion and a momentum turn such as RSI ticking up
Weaker Hammers
Forms in the middle of nowhere with no nearby level
Large upper shadow or tiny lower shadow
Prints inside a sideways range without a prior selloff
Next candle closes below the hammer low
A longer lower shadow sometimes three to five times the body can show stronger intraperiod buying. It is still only a clue until there is confirmation.
Confirmation That Improves Reliability
Use firm rules so you are not guessing.
Price confirmation Prefer a bullish follow-up candle that closes above the hammer high or a clean break above that high
Volume confirmation Higher-than-average volume on the hammer or the confirmation bar shows participation
Indicator confirmation RSI turning up from oversold, a contracting negative MACD histogram, or a reclaim of the 20-period moving average or VWAP
A green hammer is a small positive, but confirmation is still required.
How To Trade A Hammer Candlestick Step By Step
Map Context Mark trend, support and resistance, and any upcoming events. Decide your maximum risk per trade.
Verify The Candle Small body at the top, long lower shadow at least two times the body, minimal upper wick.
Wait For Confirmation Prefer a close above the hammer high. If you trade intrabar breaks, keep position sizes smaller.
Choose Your Entry
Conservative: Enter on a break above the hammer high or after the confirming close
Aggressive: Enter on a shallow retracement into the upper third of the hammer range, only when the confluence is strong
Place The Stop Just below the hammer low with a small buffer. Many traders add an ATR buffer for noise control, for example 0.2 to 0.3 times ATR.
Plan Targets
First target Nearest resistance or prior swing high
Second target A measured move using the hammer height or an ATR multiple Scale out at T1, then trail the remainder under higher lows
Manage The Trade If price hesitates near resistance, take more off. If momentum builds, trail more loosely to let the winner run. Follow your plan.
Indicator Combos That Help
RSI or Stochastics A turn up from oversold adds weight
MACD histogram Fading negative momentum hints at seller fatigue
Volume Expansion on the hammer or its confirmation strengthens the signal
Moving averages or VWAP An immediate reclaim after the hammer often improves follow-through
These tools are secondary filters. Price structure and confirmation come first.
Backtests And Research
Large backtests show the hammer can reverse the prior move around six times out of ten on average. Results are better when the candle forms in the lower third of the yearly range and when it closes green.
Even so, average follow through sits mid pack versus other patterns. Studies also note that pattern edges depend on clear rules and market conditions. This is why confirmation, defined stops, and sensible sizing are essential.
Tips And Pitfalls
Tips
Look for follow-through above the hammer high on rising volume
Prioritise confluence support, trendline, or Fibonacci plus one confirming tool
Pitfalls and Fixes
Trading without confirmation: Wait for a higher close or a clean break above the high
Ignoring context: Filter by trend and level. Skip range-bound hammers with no prior drop
Improper stops: Place the stop below the hammer low with a buffer often ATR-based
Relying on the candle alone: Use RSI, MACD, moving averages, or pivot levels to support the case
Over-concentrating exposure: Avoid stacking similar longs across correlated markets
FAQs
Is a hammer candlestick pattern bullish by itself It is a bullish clue, not a stand-alone trigger. It still requires confirmation.
What timeframe works best Many traders prefer H1 and higher for clearer signals. Lower timeframes can work with stronger filters and faster management.
Where should I place the stop Common practice is just below the hammer low with a small buffer. An ATR addition helps reduce noise.
Do longer shadows matter Yes. Longer lower shadows often reflect stronger intraperiod buying, but you still need confirmation and confluence.
What targets should I use Nearby resistance, prior swings, moving averages, Fibonacci retracements, or pivot points, and always check that the trade meets your minimum risk-reward before entry.
Share Now
Disclaimer:This content is provided for informational purposes only and does not constitute, and should not be construed as, financial, investment, or other professional advice. No statement or opinion contained herein should be considered a recommendation by Ultima Markets or the author regarding any specific investment product, strategy, or transaction. Readers are advised not to rely solely on this material when making investment decisions and should seek independent advice where appropriate.
Thank you for visiting the Ultima Markets website. Please note that this website is intended for individuals residing in jurisdictions where access is permitted by law. Ultima and its affiliated entities do not operate in your home jurisdiction.
By clicking ‘Acknowledge’, you confirm that you are entering this website solely on your own initiative and not as a result of any specific marketing outreach. You wish to obtain information from this website based on reverse solicitation principles, in accordance with the applicable laws of your home jurisdiction.