Ultima Markets App
Trade Anytime, Anywhere
Important Information
This website is managed by Ultima Markets’ international entities, and it’s important to emphasise that they are not subject to regulation by the FCA in the UK. Therefore, you must understand that you will not have the FCA’s protection when investing through this website – for example:
- You will not be guaranteed Negative Balance Protection
- You will not be protected by FCA’s leverage restrictions
- You will not have the right to settle disputes via the Financial Ombudsman Service (FOS)
- You will not be protected by Financial Services Compensation Scheme (FSCS)
- Any monies deposited will not be afforded the protection required under the FCA Client Assets Sourcebook. The level of protection for your funds will be determined by the regulations of the relevant local regulator.
Note: Ultima Markets is currently developing a dedicated website for UK clients and expects to onboard UK clients under FCA regulations in 2026.
If you would like to proceed and visit this website, you acknowledge and confirm the following:
- 1.The website is owned by Ultima Markets’ international entities and not by Ultima Markets UK Ltd, which is regulated by the FCA.
- 2.Ultima Markets Limited, or any of the Ultima Markets international entities, are neither based in the UK nor licensed by the FCA.
- 3.You are accessing the website at your own initiative and have not been solicited by Ultima Markets Limited in any way.
- 4.Investing through this website does not grant you the protections provided by the FCA.
- 5.Should you choose to invest through this website or with any of the international Ultima Markets entities, you will be subject to the rules and regulations of the relevant international regulatory authorities, not the FCA.
Ultima Markets wants to make it clear that we are duly licensed and authorised to offer the services and financial derivative products listed on our website. Individuals accessing this website and registering a trading account do so entirely of their own volition and without prior solicitation.
By confirming your decision to proceed with entering the website, you hereby affirm that this decision was solely initiated by you, and no solicitation has been made by any Ultima Markets entity.
I confirm my intention to proceed and enter this website Please direct me to the website operated by Ultima Markets , regulated by the FCA in the United KingdomBullish Divergence Basics: How To Trade It
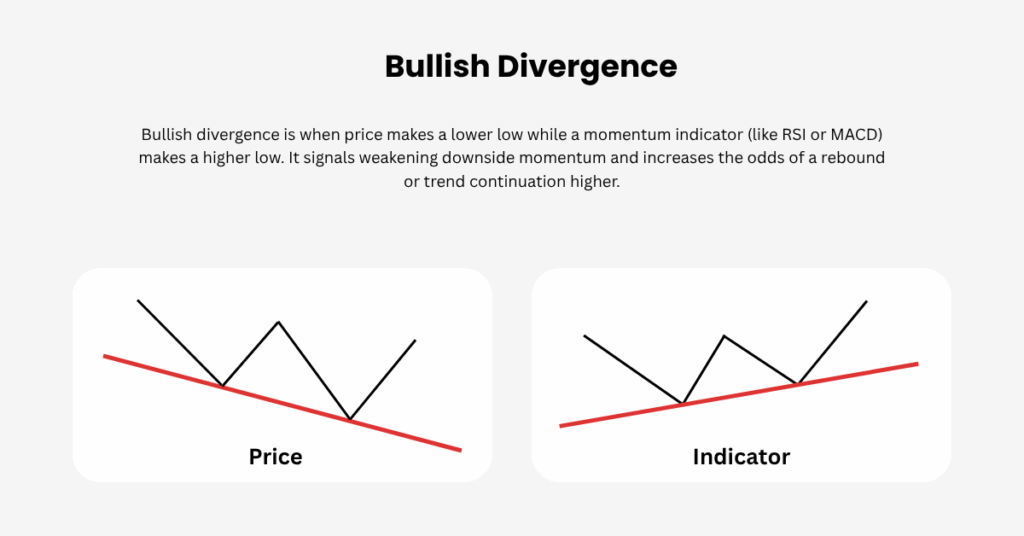
Bullish divergence occurs when price makes a lower low while a momentum oscillator makes a higher low. It signals fading downside pressure and a possible turn. Treat it as context, not a stand-alone trigger. Let structure confirm before you act.

Why Bullish Divergence Matters
Momentum reveals the underlying push and pull of fear and greed. When price digs lower but momentum refuses to confirm, sellers are losing influence. Used with structure, bullish divergence can help you:
- Spot potential bottoms earlier.
- Time pullback entries within an uptrend.
- Add confidence to setups near clear support.
Indicators And Market Context
Before we act on any signal, we need to see where it sits in the bigger picture. Indicators can hint at a shift, but trend, key levels, and timeframe tell us whether that hint deserves a trade.
Oscillators And Trend Tools
Oscillators such as RSI, MACD histogram, Stochastic, Momentum, and Rate of Change excel at reading short term shifts. Trend tools like moving averages and trendlines define the bigger picture. Use oscillators to anticipate, then use structure to validate.
Momentum And Rate of Change (RoC)
Momentum and Rate of Change (RoC) are closely related “speedometers” of price.
- Momentum (M) compares today’s price minus price X periods ago.
If M is rising, positive pressure is building; if it’s falling, pessimism is growing. - Rate of Change (RoC) compares today’s price divided by price X periods ago.
Above 1 suggests acceleration higher; below 1 suggests downside pressure.
The reason why momentum and rate of change matters for divergence is because if price undercuts its prior low but Momentum or RoC bottom at a higher trough, this quantifies that decline is slowing. That is the core of bullish divergence. Keep look-backs reasonably short for responsiveness, then anchor decisions in higher-timeframe structure for context.
Markets And Timeframes
The concept works across forex, indices, stocks, commodities, and crypto. Higher timeframes (H4, Daily, Weekly) deliver cleaner signals with fewer whipsaws; lower timeframes create more opportunities but increase noise and costs.
Types Of Bullish Divergence
Understanding the variant helps you choose the right play, whether it is reversal or continuation.
Classic Bullish Divergence
Price forms a lower low while the indicator forms a higher low. This favours potential reversals after a decline.
- Price: lower low
- Indicator: higher low
- Use: potential trend reversal after a decline
Hidden Bullish Divergence
Price forms a higher low while the indicator forms a lower low. This favours continuation entries during a healthy pullback in an uptrend.
- Price: higher low
- Indicator: lower low
- Use: trend continuation entry during a healthy pullback
Bullish Divergence vs Bearish Divergence
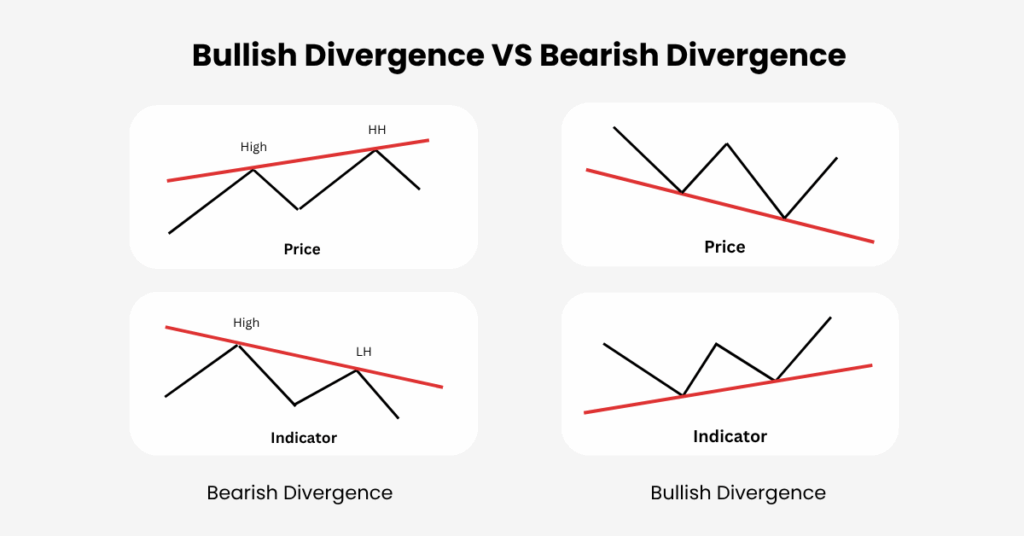
Bullish divergence has a mirror image called bearish divergence, which signals fading upside momentum. The quick compare below keeps both clear in your head.

| Aspect | Bullish Divergence | Bearish Divergence |
| Core Pattern | Price lower low and indicator higher low | Price higher high and indicator lower high |
| Use Case | Reversal after declines or pullback buys | Reversal after rallies or pullback sells |
| Hidden Variant | Price higher low and indicator lower low | Price lower high and indicator higher high |
Divergence Strength Classes
Traders often grade divergences by strength. This helps you prioritise signals instead of taking every mismatch you see.
- Class A (Strongest)
Price sets a new low; the oscillator forms a higher low than on the prior swing. These are your highest-quality reversal candidates. - Class B (Moderate)
Price forms a double bottom; the oscillator makes a higher second low. Useful, but more prone to chop. - Class C (Weakest)
Price makes a new low; the oscillator forms roughly a double bottom. Often indicates stagnation, so treat with caution.
Practical tip: Focus on Class A. Take Class B or C only with strong confluence such as firm support and a clean trigger.
How To Spot Bullish Divergence Step By Step
- Scan price first. Identify a clear move and two obvious swing lows.
- Check the same two points on your chosen oscillator.
- Confirm the mismatch and grade the signal A, B, or C.
- Add confluence using support or demand zones, volume behaviour, or a bullish candle.
- Define the trigger. Use a break above the minor swing high or a rules based indicator event such as RSI reclaiming 30 to 40.
- Set invalidation below the divergence low and size the position accordingly.
Entry, Stop, And Target Playbook
Entries
- Break above the minor swing high once divergence completes.
- Candlestick confirmation at support (hammer, bullish engulfing).
- Indicator tells: RSI trendline break or reclaim from oversold.
Stops
- Classic setups: just below the divergence low.
- Hidden setups in an uptrend: below the pullback low.
Targets
- T1 at prior swing high or a rising moving average.
- T2 near the next resistance or a measured move equal to the prior downswing.
Management
- Bank partial at T1 and move stop to breakeven.
- Trail the remainder beneath higher lows or with a short moving average.
Trading Pitfalls And Final Checks
Keeping these in view prevents most errors and keeps your process tight.

Common Mistakes And How To Avoid Them
Here are a few mistakes that traders usually fall into while …
- Forcing patterns with misaligned swing points
- Fighting strong trends without extra confluence
- Skipping invalidation instead of placing a hard stop
- Relying on one indicator rather than combining with structure and candles
Quick Checklist Before You Click Buy
- Two clear price swing lows
- Higher low on your oscillator at the second swing
- Strength grade: A is best
- Confluence at support and/or improving volume
- Defined entry trigger, stop, and at least one target
- Position size fits your risk plan
FAQs
Is RSI bullish divergence better than MACD
Neither is “best.” RSI is bounded and handy for oversold context; MACD visualises momentum via moving averages. Many traders track both and want agreement.
Does bullish divergence guarantee a rally
No. It’s an early warning, not a certainty. Always confirm and manage risk.
When should I use hidden bullish divergence
During uptrends. It helps time entries on pullbacks without chasing breakouts.
Conclusion
Bullish divergence helps you anticipate a turn; structure and a simple trigger help you act. Prioritise Class A signals, anchor risk at the divergence extreme, and scale out methodically. Fewer, better setups beat constant guessing.
Disclaimer: This content is provided for informational purposes only and does not constitute, and should not be construed as, financial, investment, or other professional advice. No statement or opinion contained here in should be considered a recommendation by Ultima Markets or the author regarding any specific investment product, strategy, or transaction. Readers are advised not to rely solely on this material when making investment decisions and should seek independent advice where appropriate.


