Ultima Markets App
Trade Anytime, Anywhere
Important Information
This website is managed by Ultima Markets’ international entities, and it’s important to emphasise that they are not subject to regulation by the FCA in the UK. Therefore, you must understand that you will not have the FCA’s protection when investing through this website – for example:
- You will not be guaranteed Negative Balance Protection
- You will not be protected by FCA’s leverage restrictions
- You will not have the right to settle disputes via the Financial Ombudsman Service (FOS)
- You will not be protected by Financial Services Compensation Scheme (FSCS)
- Any monies deposited will not be afforded the protection required under the FCA Client Assets Sourcebook. The level of protection for your funds will be determined by the regulations of the relevant local regulator.
Note: Ultima Markets is currently developing a dedicated website for UK clients and expects to onboard UK clients under FCA regulations in 2026.
If you would like to proceed and visit this website, you acknowledge and confirm the following:
- 1.The website is owned by Ultima Markets’ international entities and not by Ultima Markets UK Ltd, which is regulated by the FCA.
- 2.Ultima Markets Limited, or any of the Ultima Markets international entities, are neither based in the UK nor licensed by the FCA.
- 3.You are accessing the website at your own initiative and have not been solicited by Ultima Markets Limited in any way.
- 4.Investing through this website does not grant you the protections provided by the FCA.
- 5.Should you choose to invest through this website or with any of the international Ultima Markets entities, you will be subject to the rules and regulations of the relevant international regulatory authorities, not the FCA.
Ultima Markets wants to make it clear that we are duly licensed and authorised to offer the services and financial derivative products listed on our website. Individuals accessing this website and registering a trading account do so entirely of their own volition and without prior solicitation.
By confirming your decision to proceed with entering the website, you hereby affirm that this decision was solely initiated by you, and no solicitation has been made by any Ultima Markets entity.
I confirm my intention to proceed and enter this website Please direct me to the website operated by Ultima Markets , regulated by the FCA in the United KingdomThe Triple Top Pattern Explained for Traders
You will often see the triple top pattern across stocks, forex, and crypto whenever buyers try three times and cannot push through resistance. This article will discuss the structure, the neckline break that confirms it, and the risk rules that turn it into a practical short or hedge.
What Is The Triple Top Pattern?
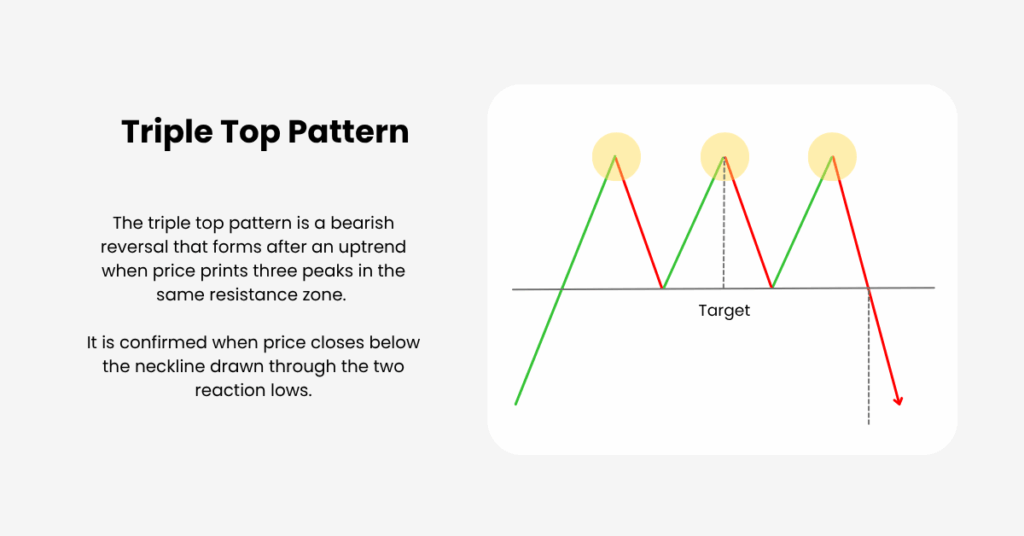
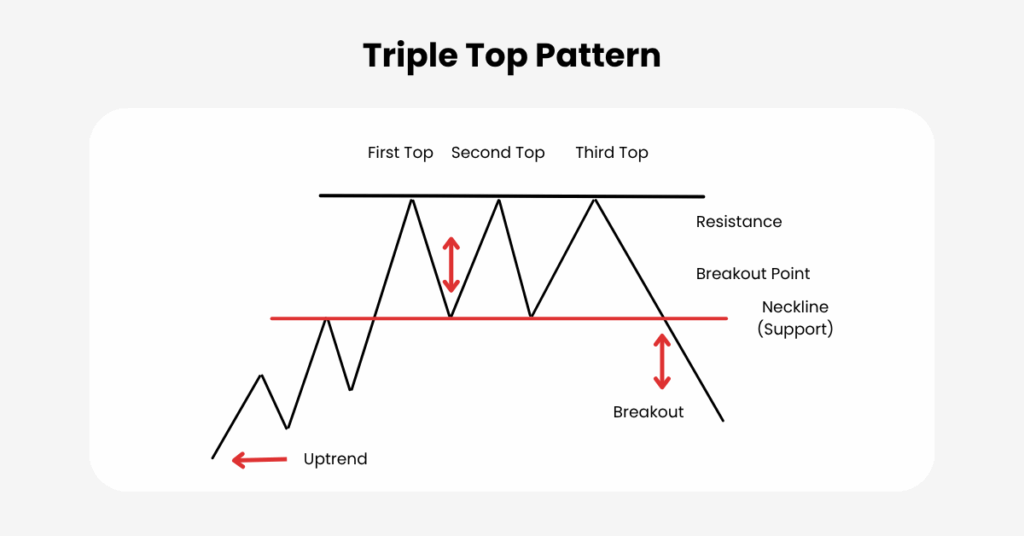
A triple top is a bearish reversal structure that forms after an uptrend. Price makes three distinct highs in roughly the same resistance zone and then confirms the pattern when it closes below the neckline drawn through the two reaction lows. Until that closing break happens, the setup is neutral and can still resolve as a range.

How The Pattern Forms
Understanding the sequence keeps your decisions consistent.
- Prior Advance Sets The Stage
A meaningful uptrend provides fuel for distribution. Without an advance, there is nothing to reverse. - Three Highs In One Supply Zone
The first high tests appetite above value. The second high shows supply is active, not accidental. The third high often reflects buyer fatigue. Treat resistance as a zone, not a single tick; small variation is normal. - Two Reaction Lows Create The Neckline
Pullbacks between the highs leave two swing lows. A flat or gently sloped line through those lows becomes the neckline and your confirmation level. - Breakdown And Optional Retest
A decisive close below the neckline completes the pattern. Many tops retest the neckline from beneath; a failed retest often offers a secondary entry with tighter risk.
On higher timeframes, quality triple tops often take weeks to months to form, commonly around three to six months on daily charts. This time element helps separate durable distribution from noisy ranges.
Distribution Psychology of the Triple Top Pattern
The shape tells a story of control shifting from buyers to sellers. On the left, demand pushes to or through perceived value, but each rally stalls in the same zone as sellers absorb bids. By the third attempt, new buyers are scarce and trapped longs begin to lighten up. The neckline break flips the script: stops trigger, late longs exit, and momentum rotates lower.

Confirmations That Improve Quality
We now connect structure to objective evidence that sellers are taking over.
- Volume And OBV
Declines that show rising volume and rallies that show lighter volume point to distribution. A falling On-Balance Volume line into the right side of the top strengthens the case. - Momentum And Divergence
RSI failing to reclaim 50 after the third high, or printing bearish divergence (lower RSI highs against flat or higher price highs), supports the bear view. A MACD rollover or bearish cross near the third high adds weight. - Trend And VWAP Behaviour
Short and medium moving averages flatten and then roll over after confirmation. On intraday views, price staying below VWAP after the break signals that sellers control the session. - Wyckoff Context
In a distribution range, a distinct Sign of Weakness followed by a Last Point of Supply near the right-hand high often precedes the actual breakdown and improves probabilities. - Market Regime Awareness
Downside breaks generally travel better in risk-off conditions. When markets transition back to risk-on, failure rates rise, so reduce size and tighten risk.
Do not confuse the bar or candlestick triple top reversal with a Point-and-Figure “triple top breakout” pattern. The P&F label “triple top breakout” is bullish and refers to a completely different framework.
Trading Rules And Risk Plan
Rules turn the pattern into repeatable decisions.
Entry
- Conservative entry: wait for a closing break below the neckline on your chosen timeframe.
- Aggressive entry: sell a failed retest of the neckline from beneath that prints a clear lower high.
Stop Loss
- Classic stop a little above the highest peak with a small ATR buffer.
- Tighter stop above the retest high if you entered on the pullback, accepting a higher stop-out rate for better reward to risk.
Profit Targets
- Measured move: distance from the highest peak to the neckline, projected downward from the breakdown.
- Scale out around 1R to reduce risk, then trail above lower swing highs or a short moving average to capture potential extension.
Expectations Management
- Many triple tops retest the neckline after the break. Plan for it rather than chasing stretched candles.
- Not every setup reaches the measured target. Use scaling and trailing so your process does not rely on a single objective.
Practical Workflow You Can Repeat
A simple sequence connects scanning, confirmation, and execution.

Scan
Look for three separated highs after a clear uptrend with a flat or gently sloped neckline drawn through the two reaction lows. Prefer patterns that took time to build and show symmetry.
Validate
Seek volume expansion on down-swings, falling OBV, RSI near or below 50 with bearish divergence, and early MA rollovers. On intraday charts, favour price that respects VWAP from below.
Plan Risk
Decide position size first. Define a stop above the highest peak with a buffer and set the measured move target. Avoid stacking multiple short exposures that are highly correlated.
Execute
Enter on a closing breakdown or on a controlled retest that fails near the neckline. Place the stop immediately and use alerts to avoid impulsive entries.
Manage
Take partial profits near 1R, trail the stop above lower highs, and tighten if volume fades or momentum stalls. Exit without hesitation if price reclaims the neckline on strong volume.
Common Mistakes To Avoid
Below are a few mistakes you might encounter while trading triple tops:
- Shorting before confirmation and fighting a still-strong trend
- Placing stops right at resistance with no buffer, or so far away that reward to risk collapses
- Chasing a long extended breakdown candle without a plan for the likely retest
- Ignoring regime, sector rotation, liquidity, and scheduled catalysts
- Treating the pattern in isolation from volume and OBV evidence
Conclusion
The triple top pattern turns repeated failure at resistance into a structured bearish plan. Three highs define the supply zone, the neckline break supplies confirmation, and objective tools help you separate genuine distribution from noise.
When you follow the sequence, plan your risk before entry, and manage with partials and trails, the triple top becomes a practical strategy for shorts or hedges across markets and timeframes.
Disclaimer: This content is provided for informational purposes only and does not constitute, and should not be construed as, financial, investment, or other professional advice. No statement or opinion contained here in should be considered a recommendation by Ultima Markets or the author regarding any specific investment product, strategy, or transaction. Readers are advised not to rely solely on this material when making investment decisions and should seek independent advice where appropriate.


