
Ultima Markets App
Trade Anytime, Anywhere
Important Information
This website is managed by Ultima Markets’ international entities, and it’s important to emphasise that they are not subject to regulation by the FCA in the UK. Therefore, you must understand that you will not have the FCA’s protection when investing through this website – for example:
- You will not be guaranteed Negative Balance Protection
- You will not be protected by FCA’s leverage restrictions
- You will not have the right to settle disputes via the Financial Ombudsman Service (FOS)
- You will not be protected by Financial Services Compensation Scheme (FSCS)
- Any monies deposited will not be afforded the protection required under the FCA Client Assets Sourcebook. The level of protection for your funds will be determined by the regulations of the relevant local regulator.
Note: Ultima Markets is currently developing a dedicated website for UK clients and expects to onboard UK clients under FCA regulations in 2026.
If you would like to proceed and visit this website, you acknowledge and confirm the following:
- 1.The website is owned by Ultima Markets’ international entities and not by Ultima Markets UK Ltd, which is regulated by the FCA.
- 2.Ultima Markets Limited, or any of the Ultima Markets international entities, are neither based in the UK nor licensed by the FCA.
- 3.You are accessing the website at your own initiative and have not been solicited by Ultima Markets Limited in any way.
- 4.Investing through this website does not grant you the protections provided by the FCA.
- 5.Should you choose to invest through this website or with any of the international Ultima Markets entities, you will be subject to the rules and regulations of the relevant international regulatory authorities, not the FCA.
Ultima Markets wants to make it clear that we are duly licensed and authorised to offer the services and financial derivative products listed on our website. Individuals accessing this website and registering a trading account do so entirely of their own volition and without prior solicitation.
By confirming your decision to proceed with entering the website, you hereby affirm that this decision was solely initiated by you, and no solicitation has been made by any Ultima Markets entity.
I confirm my intention to proceed and enter this website Please direct me to the website operated by Ultima Markets , regulated by the FCA in the United Kingdom

Quasimodo Pattern Strategies Made Simple
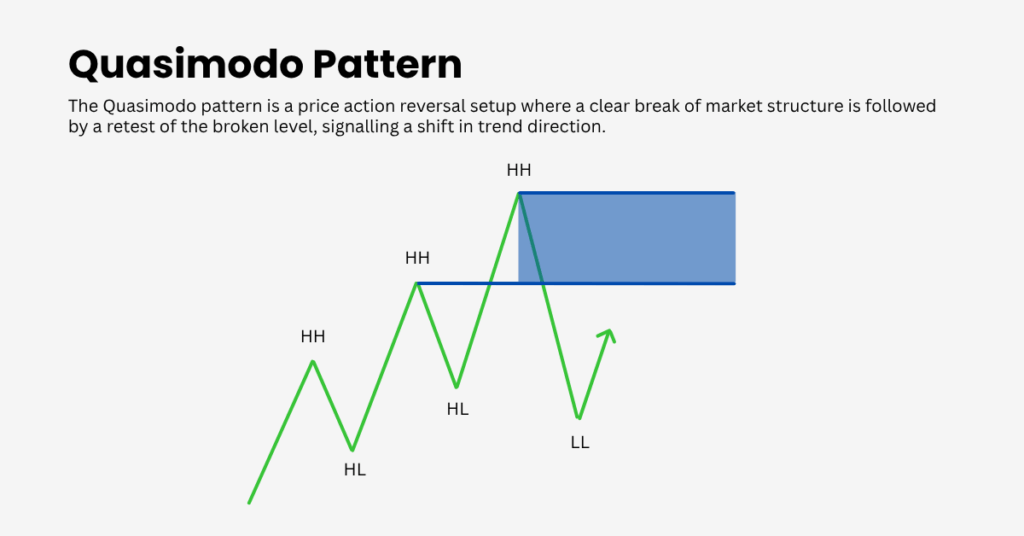
The Quasimodo pattern is a price action reversal setup. You will see a strong move, a clear break of market structure, then a return to a specific level where trapped orders sit. Trades are planned around that retest with tight and measurable risk.
If you are new to trading, think in swings rather than single candles. The pattern helps you define where the market flips control from one side to the other.
What is the Quasimodo Pattern?
At its core the pattern marks a shift from higher highs to lower highs in a topping market, or from lower lows to higher lows in a bottoming market. Traders also call it QML or Over and Under.
The essential feature is a decisive break of the previous swing point followed by a return to that break zone. That return is the Quasimodo level and it is where entries are planned.
Anatomy of the Quasimodo
Bearish Quasimodo Pattern
- An uptrend prints a higher high
- A pullback creates a higher low
- Price breaks below that higher low to form a lower low
- Price rebounds toward the old high area and forms a lower high near it
- The decline resumes from this lower high zone which is the Quasimodo level
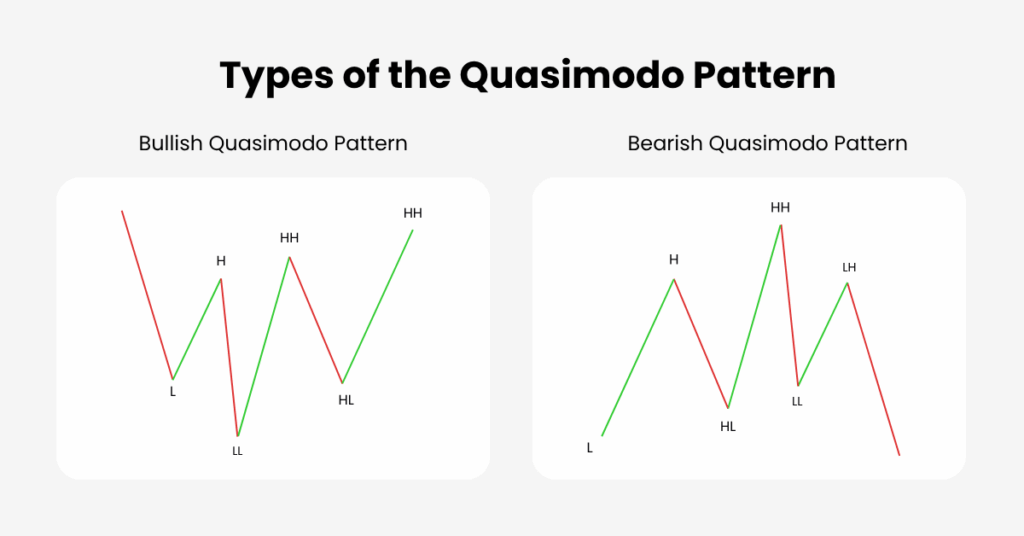
Bullish Quasimodo Pattern
- A downtrend prints a lower low
- A pullback creates a lower high
- Price breaks above that lower high to form a higher high
- Price dips back toward the old low area and forms a higher low near it
- The rally resumes from this higher low zone which is the Quasimodo level
Think of the level as the place where breakout traders from the prior leg are now trapped. When price returns, their stops provide liquidity for the fresh move.
Why it Can Work
- Structure shift gives a non-random reason to expect rotation in momentum
- Liquidity concentration sits at prior extremes and near the break zone
- Asymmetry allows small, defined risk against the extreme with room to target the opposite swing
Present Past and Future Workflow
Present: Spot the Pattern
Identify a valid Quasimodo on your current chart. You need a clear trend, a real break of the previous swing and a return to the level.
Past: Validate the Level
Scan left to find key levels that align with your Quasimodo level. These can be simple support and resistance, a prior supply or demand zone, or a pattern such as FTR fail to return where an impulsive move left an area untreated. If your Quasimodo level sits at the same price as one of these past reference points the level is usually stronger.
Future: Plan the Trade
Project the trade plan. Define where you will enter, where the stop loss goes a little beyond the zone and where to take profit. Imbalances created by one sided moves can serve as realistic take profit objectives. If price ran away earlier and did not revisit that path there is a fair chance the market will travel back through it later.
A Simple Trade Plan You Can Follow
1. Frame the bias
Start on H1 or H4 for intraday or D1 for swing trades. Mark where structure flips and set your directional bias.
2. Draw the zone
Box the Quasimodo level. For a short it is the lower high that formed near the old high. For a long it is the higher low that formed near the old low. Include the wick that swept the extreme and the closest body close.
3. Wait for price to return
Patience helps. Let price trade back into your box. Look for a rejection candle an inside bar failure or a small break of structure on M5 to M15.
4. Trigger the entry
Pick the style that suits market conditions and your experience.
- Confirmation enter after a micro break of structure away from the zone
- Limit order place a pending order near the middle of the zone after a clear rejection close
- First touch fade the outer edge only in liquid conditions with clean structure
5. Place the stop
Hide the stop a few pips or ticks beyond the zone extreme and past the nearby past key level if possible. Add a buffer for spread and typical volatility.
6. Manage targets
- Target 1 the nearest opposing swing
- Target 2 the next objective which can be an imbalance created by an earlier impulsive move
- Trail behind new lower highs or higher lows to stay with momentum
Two target approach using imbalances
If you can see two distinct imbalances created by prior impulsive moves, scale out. Take partial profit at the first imbalance and hold the remainder to the second. This helps lock gains and can improve the overall reward to risk.
Reference parameters
Risk per trade between 0.5 and 1 percent. Size the stop near the average true range on your trigger timeframe so normal noise does not knock you out. Seek at least 1.8 to 1 on the first scale out and about 3 to 1 on runners.
Quick Confluence Checks
Before you click buy or sell, look for at least two of these signals around your QML. They strengthen the setup without adding clutter.
- Support–resistance flip
Past support now acting as resistance at a bearish QML, or the reverse for bullish. - Supply or demand overlap
Your QML box sits inside a fresh supply zone for shorts or a demand zone for longs. - Momentum turn
RSI or CCI cools into the level, then expands away on the reaction. - Fibonacci cluster
The 62 to 79 retracement aligns with your QML box. - Right session timing
London or New York hours for FX and indices, main cash hours for equities, high-liquidity windows for crypto.
Rule of thumb: two strong reasons beat five weak ones. If nothing lines up, skip the trade.
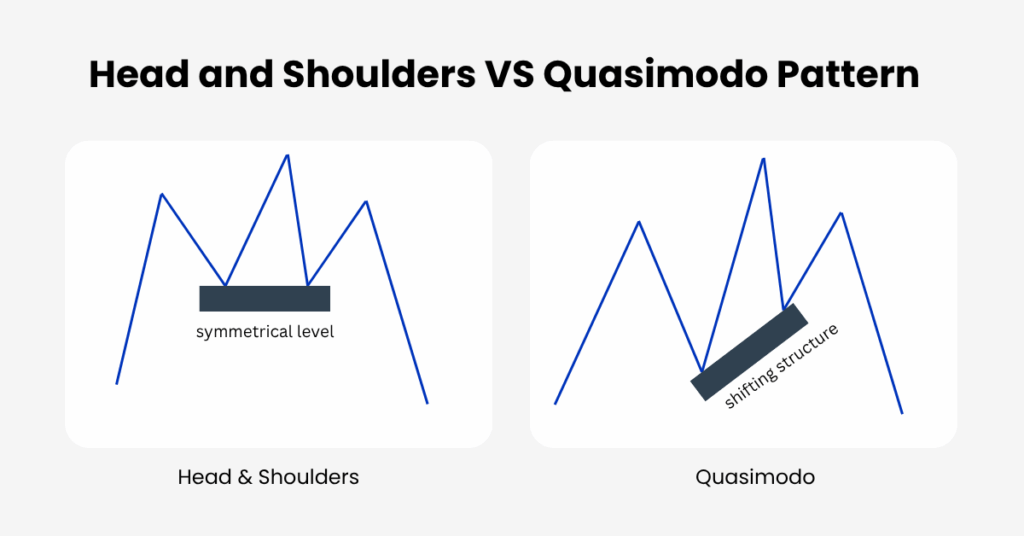
Head and Shoulders Compared with Quasimodo
They can look similar. A head and shoulders leans on a neckline break and often shows symmetry across the shoulders. The Quasimodo pattern prioritises the structural violation and the retest of that break zone. The trigger logic and stop placement differ. Treat them as related but not identical ideas.
Common Mistakes to Avoid
- Trading a shape without a genuine break of structure
- Entering the first touch during thin liquidity or right into high impact news
- Placing stops inside the zone where normal noise lives
- Fighting the dominant higher timeframe trend without strong confluence
- Assuming every imbalance must fill. They are useful targets not guarantees
Final Thoughts
The Quasimodo pattern rewards patience structure awareness and disciplined risk control. Use the present past future workflow to validate the level. Align with past key zones, set stops beyond the extreme, and use imbalances as sensible targets. With consistent journaling you will discover which instruments sessions and timeframes give you the most reliable reactions.
Disclaimer: This content is provided for informational purposes only and does not constitute, and should not be construed as, financial, investment, or other professional advice. No statement or opinion contained here in should be considered a recommendation by Ultima Markets or the author regarding any specific investment product, strategy, or transaction. Readers are advised not to rely solely on this material when making investment decisions and should seek independent advice where appropriate.
Latest Articles


FOLLOW US


Ultima Markets is a member of The Financial Commission, an international independent body responsible for resolving disputes in the Forex and CFD markets.
All clients of Ultima Markets are protected under insurance coverage provided by Willis Towers Watson (WTW), a global insurance brokerage established in 1828, with claims eligibility up to US$1,000,000 per account.
Ultima Markets is the first United CFD broker to be part of the United Nations Global Compact.
FOLLOW US
TRADE WITH US
RISK DISCLOSURE
Risk Warning:
Trading leveraged financial products, including Contracts for Difference (CFDs), carries a high level of risk and may result in losses exceeding your initial investment. These products are not suitable for all investors and should only be traded with funds you can afford to lose. You do not own or have any rights to the underlying assets of these derivatives (e.g., entitlement to dividends). Please ensure you fully understand the associated risks. Before trading, consider your level of experience, investment objectives, and seek independent financial advice if necessary. Refer to our legal documents and disclosures before making any trading decisions.
General Advice Warning:
The information provided on this website is general in nature and does not take into account your personal objectives, financial situation, or needs. Before acting on any advice, you should assess its appropriateness in light of your individual circumstances and consult our legal documentation.
Regional Restrictions:
The information and services on this website are not intended for residents of certain jurisdictions, including but not limited to the United States, United Kingdom, Singapore, and any jurisdictions subject to international sanctions. For further information, please contact our customer support team.
Regulatory Information:
Ultima Markets is a trading name shared amongst multiple entities operating in various jurisdictions. These following entities are authorised to operate under the Ultima Markets brand and trademarks.
-
Ultima Markets UK Limited, reference number 470325, is authorised and regulated by the Financial Conduct Authority (FCA). Registered address: 1 Blossom Yard, Fourth Floor, London, E1 6RS, UNITED KINGDOM.
-
Ultima Markets Ltd is authorised and regulated by the Financial Services Commission (FSC) of Mauritius as a Full-Service Investment Dealer (excluding Underwriting), under licence number GB 23201593.
Registered address: 2nd Floor, The Catalyst, 40 Silicon Avenue, Ebene Cybercity, 72201, Mauritius.
Copyright © 2026 Ultima Markets Ltd. All rights reserved.
-

Messenger


Continue on Messenger
Take the conversation to your Messenger account. You can return anytime.
Scan the QR code and then send the message that appears in your Messenger.
Open Messenger on this device.
-

Instagram

Continue on Instagram
Take the conversation to your Instagram account. You can return anytime.
Scan the QR code to open Instagram. Follow @ultima_markets to send a DM.
Open Instagram on this device.
-

Live Chat
-
