This website is managed by Ultima Markets’ international entities, and it’s important to emphasise that they are not subject to regulation by the FCA in the UK. Therefore, you must understand that you will not have the FCA’s protection when investing through this website – for example:
You will not be guaranteed Negative Balance Protection
You will not be protected by FCA’s leverage restrictions
You will not have the right to settle disputes via the Financial Ombudsman Service (FOS)
You will not be protected by Financial Services Compensation Scheme (FSCS)
Any monies deposited will not be afforded the protection required under the FCA Client Assets Sourcebook. The level of protection for your funds will be determined by the regulations of the relevant local regulator.
Note: UK clients are kindly invited to visit https://www.ultima-markets.co.uk/. Ultima Markets UK expects to begin onboarding UK clients in accordance with FCA regulatory requirements in 2026.
If you would like to proceed and visit this website, you acknowledge and confirm the following:
1.The website is owned by Ultima Markets’ international entities and not by Ultima Markets UK Ltd, which is regulated by the FCA.
2.Ultima Markets Limited, or any of the Ultima Markets international entities, are neither based in the UK nor licensed by the FCA.
3.You are accessing the website at your own initiative and have not been solicited by Ultima Markets Limited in any way.
4.Investing through this website does not grant you the protections provided by the FCA.
5.Should you choose to invest through this website or with any of the international Ultima Markets entities, you will be subject to the rules and regulations of the relevant international regulatory authorities, not the FCA.
Ultima Markets wants to make it clear that we are duly licensed and authorised to offer the services and financial derivative products listed on our website. Individuals accessing this website and registering a trading account do so entirely of their own volition and without prior solicitation.
By confirming your decision to proceed with entering the website, you hereby affirm that this decision was solely initiated by you, and no solicitation has been made by any Ultima Markets entity.
Discover what the CCI Indicator is, how it works, and when to use it. Practical setups, examples, and risk control.
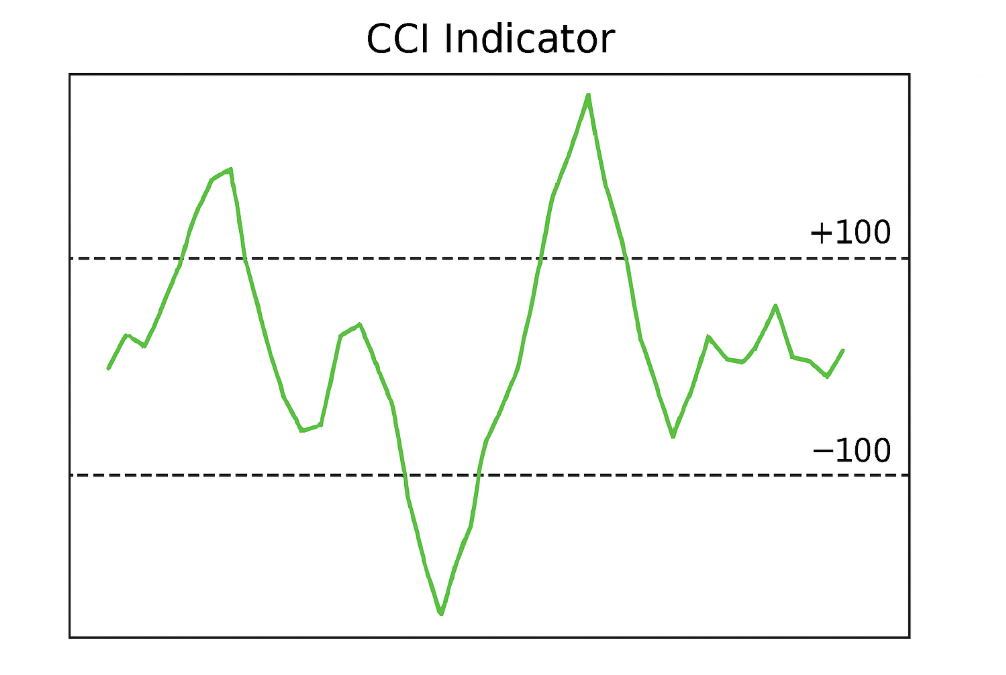
What is the CCI Indicator
The Commodity Channel Index (CCI) is a momentum oscillator that measures how far price deviates from its average over a chosen lookback. Traders use it to spot emerging trends, price extremes and potential reversals in any market, not only commodities.
Typical interpretation uses three zones:
Above +100 suggests strong upside momentum
Below −100 suggests strong downside momentum
Back inside the −100 to +100 band can indicate fading momentum or consolidation
How the CCI Indicator Works
CCI compares today’s Typical Price to its simple moving average over n periods, then scales the difference by the mean absolute deviation. When price is far above its average, CCI rises. When price is far below, CCI falls. This normalisation makes readings comparable across assets and timeframes.
CCI measures how far the current Typical Price (TP = (H+L+C)/3) sits from its recent average, scaled by the market’s mean absolute deviation (MAD) so readings are comparable across assets and timeframes.
If price is far above its recent average, the numerator is positive and large, means CCI rises.
If price is far below its average, the numerator is negative, means CCI falls.
The denominator grows when volatility widens (bigger deviations), which tempers extreme readings; in quiet markets the denominator shrinks, so smaller moves can still push CCI to ±100.
The original design was published by Donald Lambert in Commodities magazine in 1980 and was intended to surface cyclical turns. It is now widely used across equities, indices, forex and metals.
How to Set Up a CCI Indicator
Use this quick, consistent setup for any platform. It is clean, repeatable, and easy to save as a template.
Suggested presets
Swing trading: Period 20. Levels at +100 and −100. Optional extremes at +200 and −200.
Intraday: Period 14. Levels at +125 and −125 on volatile symbols.
Position trading: Period 50. Levels at +75 and −75 for smoother signals.
Add a 50-SMA and a 200-SMA on price to define trend and regime. Let the CCI Indicator time entries.
Add Moving Average 50 and Moving Average 200 on price.
Save as CCI_20_SMA50_200.tpl. Use an alert script or EA for level crosses.
Recommended layout
Main pane: price with 50-SMA and 200-SMA.
Sub-pane: CCI(20) with lines at 0, ±100, ±200.
Optional: ATR(14) in a second sub-pane for stop sizing.
Entry and exit rules to pair with this setup
Trend continuation: long only if price is above both SMAs and CCI turns up from near 0 and re-crosses +100. Short only if price is below both SMAs and CCI turns down from near 0 and re-crosses −100.
Mean reversion filter: after a push to ±200, wait for a failure swing and a cross back through ±100, then confirm with support or resistance.
Risk management: stop beyond the recent swing or use 1.5 to 2.0 × ATR(14). Trail while CCI holds its side of 0. Exit when CCI crosses and holds the other side of 0 for several bars.
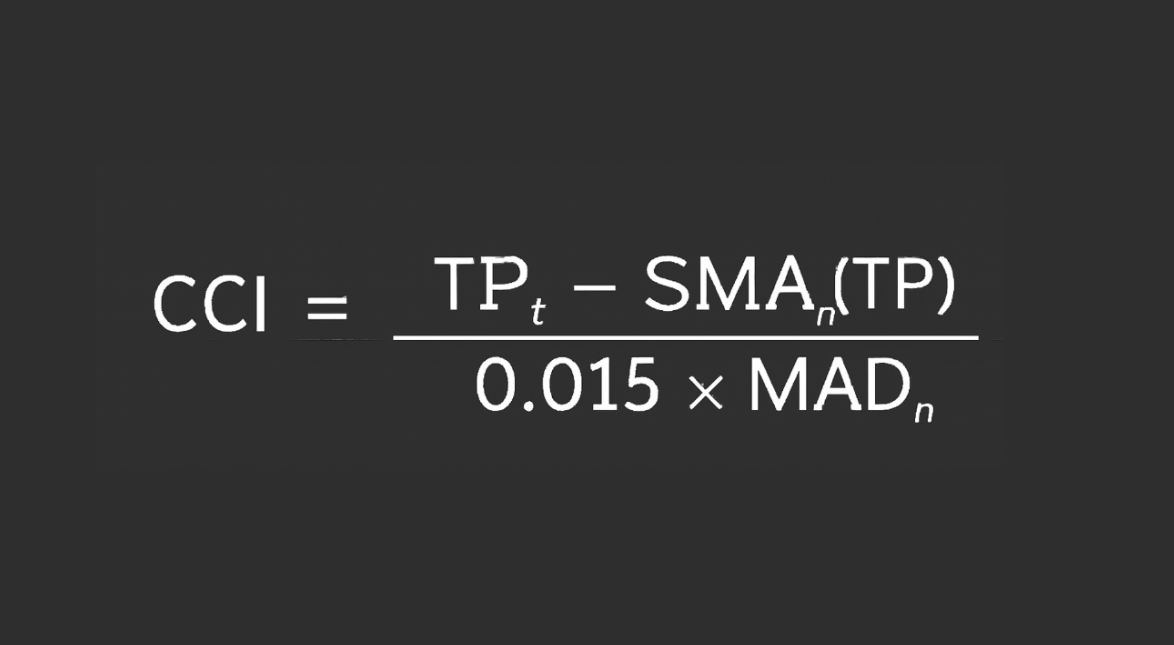
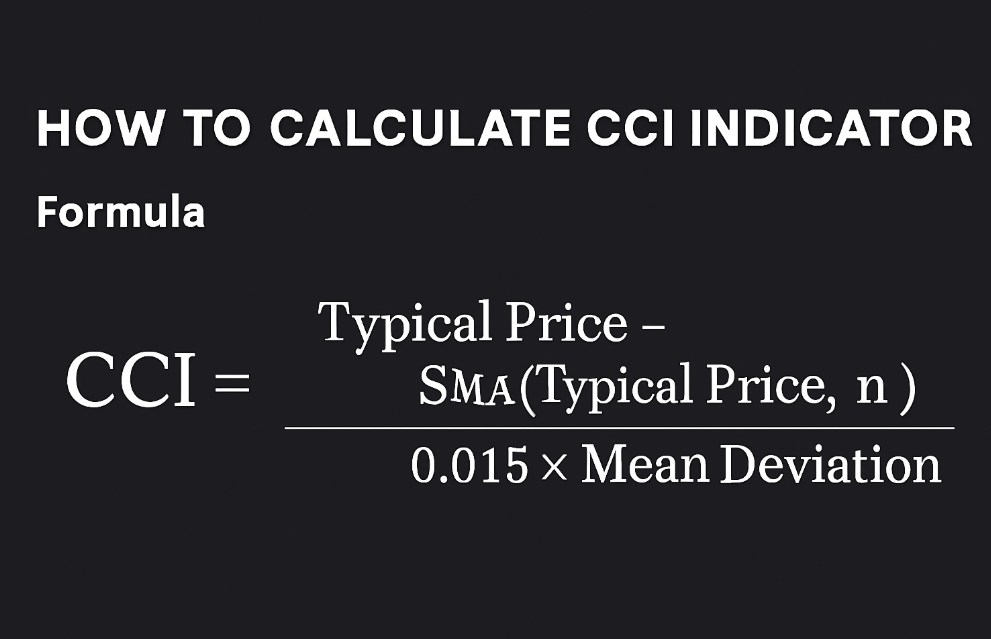
How to Calculate CCI Indicator
The CCI Indicator compares today’s Typical Price to its recent average and scales that difference by the market’s average absolute deviation.
Where:
TP (Typical Price) = (High + Low + Close)/3
SMA_n(TP) = average of TP over the last n bars
Mean Deviation_n = average of |TPi – SMAn| across the last n bars
0.015 = scaling constant so many readings fall between −100 and +100
Common inputs
Intraday or swing trading often uses 14 or 20 periods
Position trading may use 50 or 100 for smoother signals
How to Use CCI Indicator
Below are three high-probability ways to use the CCI Indicator such as trend continuation, reversal extremes, and divergence with clear entry/exit rules, filters, and examples. The goal is to turn CCI from a “signal light” into a structured process.
Trend Continuation with the CCI Indicator
Trade with the dominant trend and use CCI crosses to time entries after pullbacks.
Setup
Trend filter: price above 50-SMA and 200-SMA for longs; below both for shorts.
CCI(20) with levels at 0, ±100, optional ±200 on volatile symbols.
Long template
Bias: price above 50-SMA and 200-SMA, CCI mostly > 0.
Trigger: CCI pushes > +100, then pulls back toward 0 without breaking market structure (higher lows on price).
Entry: when CCI turns up and re-crosses +100 (or turns up from 0 if you prefer earlier entries).
Stop: below the pullback swing low or 1.5–2.0 × ATR(14).
Exit: trail while CCI stays > 0; scale out if CCI fails to make a new high while price does (momentum fade).
Price above 50/200-SMA, CCI rallies to +165, pulls back to +5, then turns up and re-crosses +100.
Entry at 1.0850; stop below the pullback low 1.0818 (≈32 pips or ~1.7×ATR).
First take-profit when CCI fails to make a new high while price does; final exit on CCI < 0 close.
±100 acts as a momentum gate. Re-crosses confirm the pullback ended in the direction of trend, reducing whipsaws.
Reversal Extremes with the CCI Indicator Fade overextended moves only after momentum exhausts and turns back through the momentum gates.
Rules
Wait for extreme prints: CCI ≥ +200 (overextension up) or ≤ −200 (overextension down).
Look for a failure swing on CCI (second push is weaker than the first) or a price rejection at S/R.
Trigger after momentum truly shifts: cross back through +100 (from above) for short ideas, or cross back through −100 (from below) for long ideas.
Confirm with structure: a nearby support/resistance, trendline break, or MA reclaim.
Risk & exits
Stops beyond the recent extreme (e.g., above the wick high after +200).
Partial profit at the zero line; full exit when CCI stalls near the opposite band or price meets key S/R.
Example (XAUUSD, hypothetical)
CCI spikes to +230 on a news pop into daily resistance.
Next push up prints +185 (weaker), price shows an upper wick.
Short only after CCI crosses back below +100; stop above the spike high; scale at CCI≈0.
Extremes flag exhaustion risk; the cross back through ±100 proves momentum actually flipped, filtering out early/heroic fades.
Divergence with the CCI Indicator
Use divergence as an early warning, then wait for confirmation to avoid fighting persistent trends.
Types
Bearish divergence: price makes a higher high, CCI makes a lower high → upside momentum waning.
Bullish divergence: price makes a lower low, CCI makes a higher low → downside momentum waning.
Confirmation flow
Spot divergence.
Look for structure (double top/bottom, S/R, channel boundary).
Wait for CCI trigger: cross of the zero line or re-cross of ±100 in the new direction.
Manage risk tighter than trend trades; divergences can persist.
Example (NASDAQ CFD, hypothetical)
Price forms a higher high; CCI forms a lower high (bearish divergence) at resistance.
Short after CCI crosses below 0 (safer) or re-crosses −100 (stricter).
Stop above the recent high; partial profit at prior swing; exit on CCI back above 0.
Divergence doesn’t predict the turn, the trigger confirms it.
Filters that dramatically improve CCI results
Market regime first: trend vs range. In ranges, fade moves from ±100 back toward 0; in trends, trade re-crosses with the trend.
ATR session filter: only take signals during liquid sessions (e.g., London/NY overlap for FX) to reduce false breaks.
Multi-timeframe alignment: Use H4 CCI > 0 to allow longs on H1 re-cross +100; flip logic for shorts.
Instrument-based levels: in very volatile assets, raise gates to ±150/±200 to avoid noise.
Two compact examples
Trend long (GBPJPY, hypothetical)
Bias: above 50/200-SMA, CCI swings mostly > 0.
Sequence: +135 → pullback to +8 → re-cross +100.
Entry at 197.20; stop 196.70 (≈ 50 pips ≈ 1.8×ATR).
Scale at prior high; full exit on CCI < 0 close.
Reversal short (US30, hypothetical)
Extreme: CCI prints +225 into weekly resistance.
Failure swing: next push tops at +170.
Trigger: cross back below +100 → short.
Stop above spike; take profits into CCI ≈ 0 and previous swing low.
The CCI Indicator is strongest as a confirmation and timing tool. Let structure and trend define the trade idea, use ±100 re-crosses (and ±200 extremes) to enter, manage, and exit with discipline.
Advantages and Disadvantages
Advantages
Works across markets and timeframes: CCI adapts to forex, indices, metals and equities on intraday and swing charts, so you can keep one ruleset across your watchlist.
Clear momentum gates: Breaks of +100 and −100 give objective confirmation that impulse is strong, useful for timing trend continuation entries.
Detects exhaustion early: Prints beyond ±200 often flag overextension. When CCI then crosses back through ±100, you have a structured countertrend trigger.
Unbounded scale helps in power trends: Unlike bounded oscillators, CCI still differentiates moderate from explosive momentum. +120 versus +260 are not the same and you can tier risk accordingly.
Robust math: Scaling by mean absolute deviation keeps readings comparable when volatility shifts, so signals are less distorted by single outliers.
Simple to combine with structure: Zero line, ±100 and ±200 pair naturally with support resistance, moving averages and swing highs and lows for cleaner decisions.
Disadvantages
Not a standalone system: Raw crosses can whipsaw in ranges. You still need market structure or a trend filter to separate good from bad signals.
Unbounded does not equal overbought oversold: Treating ±100 as auto reversal leads to shorting strong uptrends or bottom picking strong downtrends.
Lag versus price spikes: Because it averages past data, CCI can confirm after the first burst. If you chase every cross you may enter late.
Level calibration is instrument dependent: One size does not fit all. Volatile symbols may require ±150 or ±200 to reduce noise. Calm pairs may work with ±75 to ±100.
Regime sensitivity: In tight chop around the zero line, signals lose edge. Without a range framework you can stack small losses.
CCI vs Other Oscillators
The unbounded nature of CCI can identify powerful momentum expansions where bounded oscillators compress near their caps. The trade-off is you must calibrate levels to the instrument.
Indicator
Scale
Core use
Typical thresholds
CCI
Unbounded
Deviation from average using mean deviation
±100, ±200
RSI
0 to 100
Velocity of gains vs losses
70 and 30
Stochastic
0 to 100
Close relative to recent range
80 and 20
Conclusion
The CCI Indicator works best as a confirmation and timing tool. Let market structure set the idea, use the zero line to define bias, and reserve the ±100 and ±200 levels for momentum gates and true extremes. Keep your process consistent across symbols and timeframes, then adjust risk with ATR and recent swing structure.
Trading with a regulated, education-first broker helps you apply this with discipline. Ultima Markets provides multi-platform access, reliable execution, and UM Academy guides so you can test a CCI-based plan before risking capital. Our UK entity is FCA regulated, reinforcing our commitment to strong oversight and transparent operations. If you are new to the CCI Indicator, start with n=20 and levels at ±100 and ±200, forward test on a demo, and document results in a simple checklist.
Share Now
Disclaimer:This content is provided for informational purposes only and does not constitute, and should not be construed as, financial, investment, or other professional advice. No statement or opinion contained herein should be considered a recommendation by Ultima Markets or the author regarding any specific investment product, strategy, or transaction. Readers are advised not to rely solely on this material when making investment decisions and should seek independent advice where appropriate.
Thank you for visiting the Ultima Markets website. Please note that this website is intended for individuals residing in jurisdictions where access is permitted by law. Ultima and its affiliated entities do not operate in your home jurisdiction.
By clicking ‘Acknowledge’, you confirm that you are entering this website solely on your own initiative and not as a result of any specific marketing outreach. You wish to obtain information from this website based on reverse solicitation principles, in accordance with the applicable laws of your home jurisdiction.