This website is managed by Ultima Markets’ international entities, and it’s important to emphasise that they are not subject to regulation by the FCA in the UK. Therefore, you must understand that you will not have the FCA’s protection when investing through this website – for example:
You will not be guaranteed Negative Balance Protection
You will not be protected by FCA’s leverage restrictions
You will not have the right to settle disputes via the Financial Ombudsman Service (FOS)
You will not be protected by Financial Services Compensation Scheme (FSCS)
Any monies deposited will not be afforded the protection required under the FCA Client Assets Sourcebook. The level of protection for your funds will be determined by the regulations of the relevant local regulator.
Note: UK clients are kindly invited to visit https://www.ultima-markets.co.uk/. Ultima Markets UK expects to begin onboarding UK clients in accordance with FCA regulatory requirements in 2026.
If you would like to proceed and visit this website, you acknowledge and confirm the following:
1.The website is owned by Ultima Markets’ international entities and not by Ultima Markets UK Ltd, which is regulated by the FCA.
2.Ultima Markets Limited, or any of the Ultima Markets international entities, are neither based in the UK nor licensed by the FCA.
3.You are accessing the website at your own initiative and have not been solicited by Ultima Markets Limited in any way.
4.Investing through this website does not grant you the protections provided by the FCA.
5.Should you choose to invest through this website or with any of the international Ultima Markets entities, you will be subject to the rules and regulations of the relevant international regulatory authorities, not the FCA.
Ultima Markets wants to make it clear that we are duly licensed and authorised to offer the services and financial derivative products listed on our website. Individuals accessing this website and registering a trading account do so entirely of their own volition and without prior solicitation.
By confirming your decision to proceed with entering the website, you hereby affirm that this decision was solely initiated by you, and no solicitation has been made by any Ultima Markets entity.
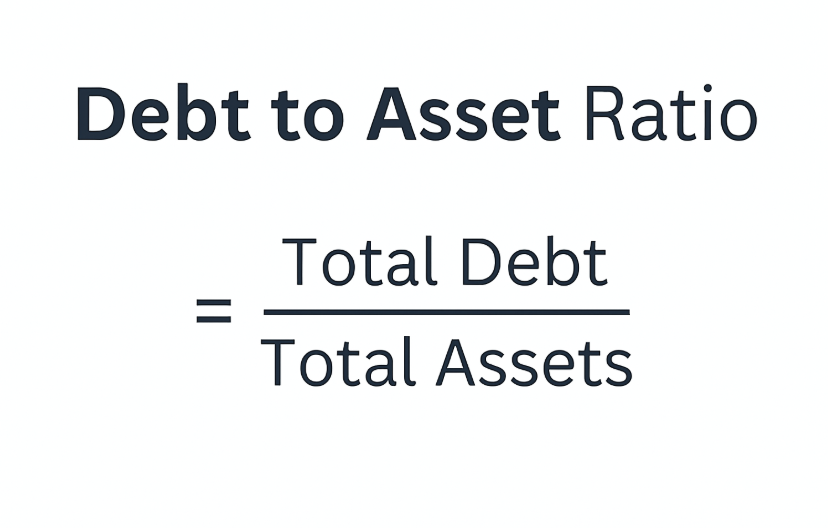
What is Debt to Asset Ratio? The Debt to Asset Ratio is a financial measure that shows how much of a company’s assets are financed through debt. It is calculated by dividing total debt by total assets. A higher ratio means greater reliance on borrowing, while a lower ratio suggests stronger equity financing and lower […]
What is Debt to Asset Ratio?
The Debt to Asset Ratio is a financial measure that shows how much of a company’s assets are financed through debt. It is calculated by dividing total debt by total assets. A higher ratio means greater reliance on borrowing, while a lower ratio suggests stronger equity financing and lower financial risk.
Debt to Asset Ratio Calculation
The formula is: Debt to Asset Ratio = Total Debt ÷ Total Assets
Total Debt includes both short-term borrowings (like bank loans or bonds due within a year) and long-term debt (mortgages, bonds payable, lease liabilities).
Total Assets cover everything a company owns, such as cash, receivables, equipment, property, and intangible assets.
Example Calculation:
If a company reports $500,000 in total debt and $1,000,000 in total assets, its ratio is 50%. This means half of its assets are financed by debt.
500,000÷1,000,000=0.5 or 50%
Example of How to Use the Total Debt-to-Total Assets Ratio
Here are the tech company examples of using the Total Debt-to-Total Assets Ratio:
Company
Total Debt / Total Assets (approx)
Key Numbers
What It Tells Us
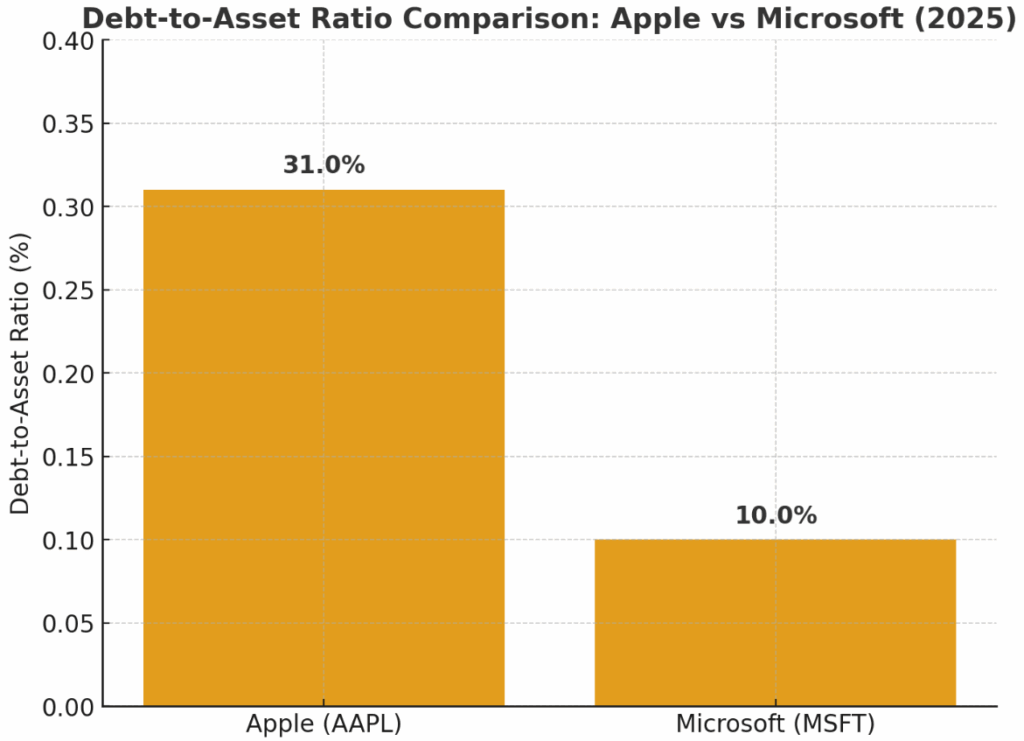
Apple (AAPL)
~ 0.31 (31%) as of Q2-2025
Short-term + long-term debt ≈ $101.7B; Total assets ≈ $331.5B
Apple has moderate leverage. About 31% of its assets are financed by debt. This is neither very high nor very low: enough borrowing to leverage growth & operations, but not so much that risk is extremely elevated. Also, historical trend shows a somewhat stable or slightly declining debt ratio, which signals cautious debt management.
Microsoft (MSFT)
~ 0.10 (10%) as of Q2-2025
Debt (short + long term) ≈ $60.6B; Total assets ≈ $619.0B
Microsoft carries much lower debt relative to its assets. Only about 10%. This suggests very conservative financing less risk of debt pressures, more flexibility to invest, but possibly more reliance on equity or internal cash flows. It also means Microsoft has a lot of “dry powder” to borrow if needed.
Both Apple and Microsoft are tech firms, but their business models differ. Apple is hardware & software, with significant investment in physical goods, inventory, supply chain. Thus some debt is necessary. Microsoft is more software / cloud / services, less need for physical assets, thus lower asset base for liabilities. So a 30-40% debt ratio for a company like Apple isn’t unusual, for Microsoft, 10% is more in line with its asset structure.
Risk Management
Apple: With ~31% debt ratio, Apple has some risk if interest rates rise greatly or revenues dip sharply, but it has historically strong cash flow, strong margins, and asset base to weather shocks.
Microsoft: With ~10%, much less exposure. If they wanted, they could likely raise debt without severely stressing solvency metrics. Lower leverage gives more cushion.
Trend Over Time
For Apple, data shows its debt ratio over past years has hovered in the ~0.28-0.37 range, but with slight declines recently. This suggests measured leverage, possibly paying down debt or increasing asset base.
Microsoft has also shown its ratio relatively stable or slightly declining, reflecting conservative debt policy.
In tech, especially service/software/cloud sectors, lower debt ratios are often preferred because assets may be less tangible, margins can swing if R&D or infrastructure spending increases, and debt servicing can eat into flexibility.
Apple’s ~31% is moderate, acceptable, especially given its size, brand, cash flow, and capacity to generate profits.
Microsoft’s ~10% is very low, meaning less risk but also possibly under-leveraged in terms of tax or yield benefits of debt.
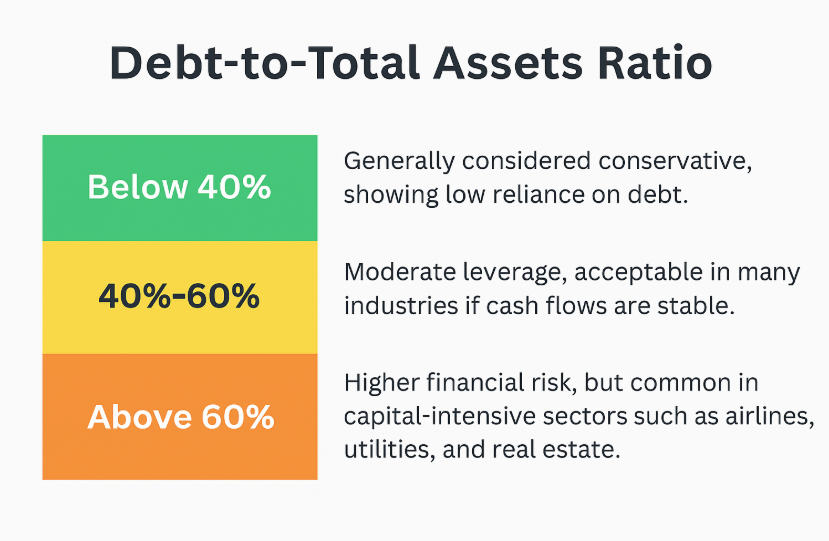
What Is a Good Total Debt-to-Total Assets Ratio?
A good Debt-to-Total Assets Ratio is generally below 40%, showing low reliance on debt and stronger financial stability. Ratios between 40% and 60% are considered moderate, while anything above 60% signals higher financial risk. However, the “good” level varies by industry, business model, and cash flow strength.
For accuracy, always compare a company’s ratio to its industry average. For example, technology firms typically have lower ratios than manufacturing or infrastructure companies.
Is a Low Total Debt-to-Total Asset Ratio Good?
Yes, in many cases, a low ratio is a sign of financial strength because it means lower risk of default, less exposure to interest rate hikes and greater flexibility in downturns.
However, too little debt can also mean a company is missing opportunities. Debt, when managed wisely, can fuel expansion, support acquisitions, and improve tax efficiency. The key is balance: not overleveraged, but not underutilising debt either.
Limitations of Using the Total Debt-to-Total Assets Ratio
While useful, the ratio is not perfect. Key limitations include:
Industry differences – Comparing a software firm to a utility provider can be misleading.
Asset quality – Not all assets are equally liquid; intangibles may not help repay debt.
Debt structure – The ratio doesn’t show maturity timelines; short-term vs. long-term debt risk matters.
Cash flow blind spots – A company may have manageable debt but weak cash flows, making repayment difficult.
Accounting practices – Differences in asset valuation, leases, or debt recognition across countries may distort comparisons.
This is why analysts pair it with other ratios like debt-to-equity, current ratio, and interest coverage for a complete picture.
Key Takeaways for Investors and Traders
Benchmark Against Industry Peers
Always compare a company’s debt-to-asset ratio with similar firms in the same sector. For example, a 50% ratio may be normal in airlines but considered high in software companies.
Track the Trend Over Time
Look at 3–5 years of data. A steadily rising ratio could mean the company is relying more on debt for growth, potentially increasing financial risk. A falling ratio often signals deleveraging or stronger equity funding.
Combine with Other Ratios
Debt-to-asset ratio alone doesn’t give the full picture. Use it with Debt-to-Equity, Interest Coverage, and Current Ratio to assess solvency, liquidity, and the ability to service obligations.
Analyse Cash Flow Strength
Even if the ratio looks safe, weak cash flow could mean the company struggles to pay interest or refinance debt. Strong operating cash flow makes higher debt levels more manageable.
Consider Debt Maturity
Short-term debt puts pressure on liquidity. Long-term debt may be safer if matched with long-lived assets and stable revenues.
Watch the Interest Rate Environment
Rising rates increase borrowing costs, especially for companies with variable-rate loans. Traders should monitor central bank policy, a company with high debt could see margins shrink when rates rise.
Use in Trading and Investment Strategies
Value investors may prefer companies with conservative ratios for stability. Growth traders might accept higher leverage if debt fuels expansion in high-return industries. Credit and bond investors use this ratio to gauge default risk.
Look for Red Flags
A ratio above 1 (debt greater than assets) is rare and often signals distress. If the ratio rises while revenues or profits fall, that’s a potential warning sign for traders to avoid or short.
Conclusion
The Debt-to-Asset Ratio is a simple yet powerful way to gauge a company’s financial leverage. By showing how much of a firm’s assets are financed through debt, it helps investors and traders assess risk, stability, and growth potential. Still, no single ratio can tell the full story, it should be analysed alongside cash flow, industry benchmarks, and other solvency metrics.
At Ultima Markets, our mission is to provide traders with the tools and insights they need to make informed decisions. By combining essential financial knowledge, like understanding leverage ratios, with advanced trading platforms and real-time market analysis, we help traders navigate opportunities with clarity and confidence.
Share Now
Disclaimer:This content is provided for informational purposes only and does not constitute, and should not be construed as, financial, investment, or other professional advice. No statement or opinion contained herein should be considered a recommendation by Ultima Markets or the author regarding any specific investment product, strategy, or transaction. Readers are advised not to rely solely on this material when making investment decisions and should seek independent advice where appropriate.
Thank you for visiting the Ultima Markets website. Please note that this website is intended for individuals residing in jurisdictions where access is permitted by law. Ultima and its affiliated entities do not operate in your home jurisdiction.
By clicking ‘Acknowledge’, you confirm that you are entering this website solely on your own initiative and not as a result of any specific marketing outreach. You wish to obtain information from this website based on reverse solicitation principles, in accordance with the applicable laws of your home jurisdiction.