This website is managed by Ultima Markets’ international entities, and it’s important to emphasise that they are not subject to regulation by the FCA in the UK. Therefore, you must understand that you will not have the FCA’s protection when investing through this website – for example:
You will not be guaranteed Negative Balance Protection
You will not be protected by FCA’s leverage restrictions
You will not have the right to settle disputes via the Financial Ombudsman Service (FOS)
You will not be protected by Financial Services Compensation Scheme (FSCS)
Any monies deposited will not be afforded the protection required under the FCA Client Assets Sourcebook. The level of protection for your funds will be determined by the regulations of the relevant local regulator.
Note: UK clients are kindly invited to visit https://www.ultima-markets.co.uk/. Ultima Markets UK expects to begin onboarding UK clients in accordance with FCA regulatory requirements in 2026.
If you would like to proceed and visit this website, you acknowledge and confirm the following:
1.The website is owned by Ultima Markets’ international entities and not by Ultima Markets UK Ltd, which is regulated by the FCA.
2.Ultima Markets Limited, or any of the Ultima Markets international entities, are neither based in the UK nor licensed by the FCA.
3.You are accessing the website at your own initiative and have not been solicited by Ultima Markets Limited in any way.
4.Investing through this website does not grant you the protections provided by the FCA.
5.Should you choose to invest through this website or with any of the international Ultima Markets entities, you will be subject to the rules and regulations of the relevant international regulatory authorities, not the FCA.
Ultima Markets wants to make it clear that we are duly licensed and authorised to offer the services and financial derivative products listed on our website. Individuals accessing this website and registering a trading account do so entirely of their own volition and without prior solicitation.
By confirming your decision to proceed with entering the website, you hereby affirm that this decision was solely initiated by you, and no solicitation has been made by any Ultima Markets entity.
What Is the Death Cross in Trading In technical analysis, few patterns attract as much attention as the death cross. With its dramatic name and history of appearing before major downturns, it is often highlighted in financial news and trading discussions. But what is the death cross in trading, how does it form, and how […]
What Is the Death Cross in Trading
In technical analysis, few patterns attract as much attention as the death cross. With its dramatic name and history of appearing before major downturns, it is often highlighted in financial news and trading discussions. But what is the death cross in trading, how does it form, and how reliable is it as a signal?
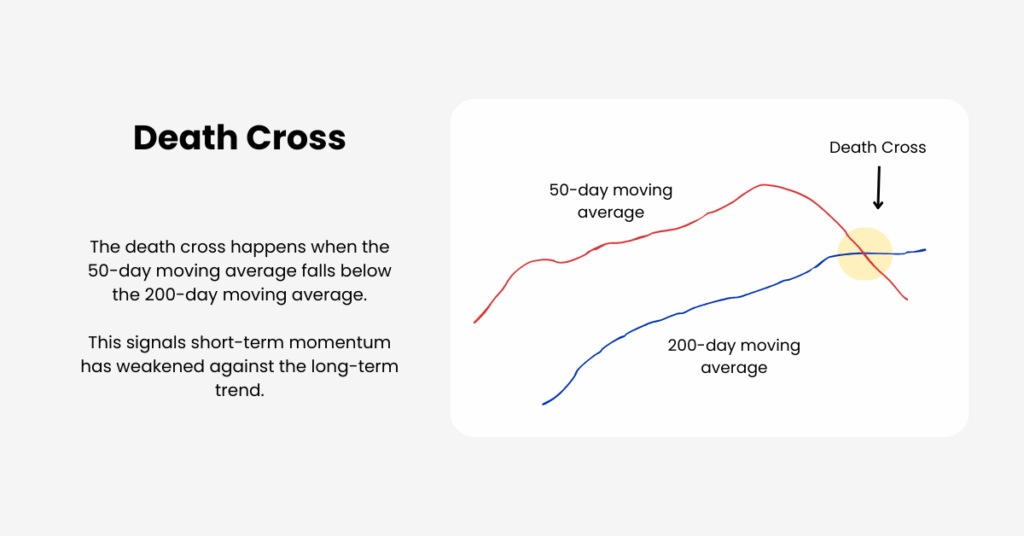
Understanding the Death Cross
A death cross occurs when a short-term moving average, most commonly the 50-day simple moving average (SMA), crosses below a long-term moving average, usually the 200-day SMA. The 50-day average reflects medium-term momentum, while the 200-day average shows the broader market trend.
When the shorter average dips under the longer one, it suggests that recent weakness is starting to dominate long-term strength.
This shift does not happen overnight. It reflects a gradual change in sentiment, where buyers lose conviction and sellers begin to control the market. Because of this, the death cross is often viewed as a warning that a bearish phase may be developing.
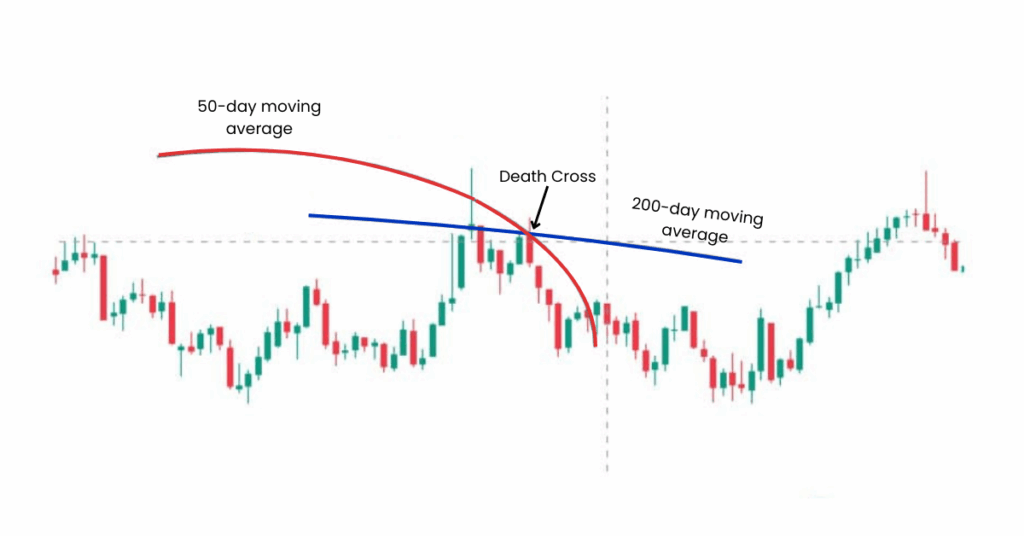
The Three Phases of a Death Cross
The death cross is not a sudden event—it develops in stages:
Uptrend slows – Buying momentum fades, and price begins to soften.
Crossover – The 50-day SMA falls below the 200-day SMA.
Confirmation – If the downtrend continues and prices stay weak, the signal is validated.
If prices rebound quickly and the 50-day average turns back up, the death cross is considered a false signal.
Golden Cross vs Death Cross
When learning what is the death cross in trading, it’s also useful to contrast it with its opposite pattern, the golden cross.
Golden Cross: The 50-day SMA rises above the 200-day SMA, suggesting a potential long-term uptrend.
Death Cross: The 50-day SMA falls below the 200-day SMA, suggesting bearish momentum.
Together, these patterns give traders a simple framework for spotting long-term trend shifts.
Why Traders Watch the Death Cross
The death cross is widely discussed because it has appeared before several major downturns. For example, the NASDAQ 100 flashed a death cross ahead of the dot-com crash in 2000, while the S&P 500 formed one in May 2008, just months before the financial crisis deepened. Even as far back as 1929, a death cross was visible before the Great Depression.
However, not every signal leads to disaster. During the 2010s, several death crosses appeared in U.S. markets but quickly reversed as stocks rallied. This makes it essential to view the death cross as a warning sign, not a certainty.
How Reliable Is the Death Cross?
The reliability of the death cross has been widely debated. On one hand, it has successfully appeared before some of the biggest bear markets in history. On the other, research shows that it often lags behind price action and can flash after much of the decline has already occurred.
For example, LPL Research found that since 1950 the S&P 500 has delivered an average return of 6.3% in the 12 months following a death cross, with the index finishing higher about 72% of the time. A Reuters analysis of 24 death crosses over 50 years found that in more than half the cases, the market had already bottomed before the crossover took place. In the rest, prices fell further, with an additional average decline of nearly 19%.
These figures highlight that the death cross should not be used in isolation. It can signal increased risk, but it is not a certainty of deeper losses.
Confirming the Death Cross
Because the death cross is a lagging indicator, traders often seek extra confirmation before acting. To fully grasp what is the death cross in trading, you also need to know how traders confirm it using volume, momentum, and price action.
Volume: Heavy selling volume alongside the crossover strengthens the bearish outlook.
Momentum Indicators: Tools like MACD or RSI can reveal if weakness is accelerating.
Price Action: Failed rallies below declining moving averages can confirm that sellers remain in control.
Some traders also watch for price falling below the 200-day SMA as an early warning before the crossover itself.
Variations of the Pattern
Although the 50-day and 200-day averages are the standard, some traders adjust the formula. Shorter-term players may prefer the 20-day and 50-day cross for quicker signals, while others use the 100-day average instead of the 200-day to capture medium-term shifts. The concept is also applied to shorter timeframes, such as hourly or four-hour charts, especially in fast-moving markets like forex and crypto.
Using the Death Cross in Practice
In practice, most traders see the death cross as a risk management tool rather than a direct trigger for buying or selling. For some, it is a signal to reduce exposure, tighten stop-losses, or avoid entering new long positions. For others, it can act as confirmation to consider short trades if other indicators support the bearish outlook.
Long-term investors may use the death cross to rebalance portfolios away from riskier assets until conditions improve. The pattern often proves more useful on individual stocks, where momentum shifts can be sharper, than on broad indices, where the effect is averaged out.
Key Takeaway
So what is the death cross in trading? It is a classic technical signal that highlights potential bearish momentum when the 50-day moving average falls below the 200-day. It has appeared ahead of major downturns but has also produced false alarms, especially in choppy markets.
Traders should use it as a context signal rather than a standalone forecast. Combined with confirmation tools like volume, momentum indicators, and careful risk management, the death cross can help provide clarity in times of market uncertainty.
Share Now
Disclaimer:This content is provided for informational purposes only and does not constitute, and should not be construed as, financial, investment, or other professional advice. No statement or opinion contained herein should be considered a recommendation by Ultima Markets or the author regarding any specific investment product, strategy, or transaction. Readers are advised not to rely solely on this material when making investment decisions and should seek independent advice where appropriate.
Thank you for visiting the Ultima Markets website. Please note that this website is intended for individuals residing in jurisdictions where access is permitted by law. Ultima and its affiliated entities do not operate in your home jurisdiction.
By clicking ‘Acknowledge’, you confirm that you are entering this website solely on your own initiative and not as a result of any specific marketing outreach. You wish to obtain information from this website based on reverse solicitation principles, in accordance with the applicable laws of your home jurisdiction.