Ultima Markets App
Trade Anytime, Anywhere
Important Information
This website is managed by Ultima Markets’ international entities, and it’s important to emphasise that they are not subject to regulation by the FCA in the UK. Therefore, you must understand that you will not have the FCA’s protection when investing through this website – for example:
- You will not be guaranteed Negative Balance Protection
- You will not be protected by FCA’s leverage restrictions
- You will not have the right to settle disputes via the Financial Ombudsman Service (FOS)
- You will not be protected by Financial Services Compensation Scheme (FSCS)
- Any monies deposited will not be afforded the protection required under the FCA Client Assets Sourcebook. The level of protection for your funds will be determined by the regulations of the relevant local regulator.
Note: Ultima Markets is currently developing a dedicated website for UK clients and expects to onboard UK clients under FCA regulations in 2026.
If you would like to proceed and visit this website, you acknowledge and confirm the following:
- 1.The website is owned by Ultima Markets’ international entities and not by Ultima Markets UK Ltd, which is regulated by the FCA.
- 2.Ultima Markets Limited, or any of the Ultima Markets international entities, are neither based in the UK nor licensed by the FCA.
- 3.You are accessing the website at your own initiative and have not been solicited by Ultima Markets Limited in any way.
- 4.Investing through this website does not grant you the protections provided by the FCA.
- 5.Should you choose to invest through this website or with any of the international Ultima Markets entities, you will be subject to the rules and regulations of the relevant international regulatory authorities, not the FCA.
Ultima Markets wants to make it clear that we are duly licensed and authorised to offer the services and financial derivative products listed on our website. Individuals accessing this website and registering a trading account do so entirely of their own volition and without prior solicitation.
By confirming your decision to proceed with entering the website, you hereby affirm that this decision was solely initiated by you, and no solicitation has been made by any Ultima Markets entity.
I confirm my intention to proceed and enter this website Please direct me to the website operated by Ultima Markets , regulated by the FCA in the United KingdomThe Correct Way to M Pattern Trading
If you’re looking to identify potential market reversals, the M trading pattern, often called the double top, should be a key tool in your technical analysis toolkit. This pattern signals that an uptrend is losing momentum, which could be a perfect time for traders to enter a bearish position. Understanding how to utilise the M pattern trading can give you an edge in spotting trend changes before they happen.
The M pattern is similar to other reversal formations, like the head and shoulders pattern, both of which signal shifts from bullish to bearish momentum. Let’s dive into how the M pattern works, how to identify it, and how to trade it effectively.
What is the M Trading Pattern?

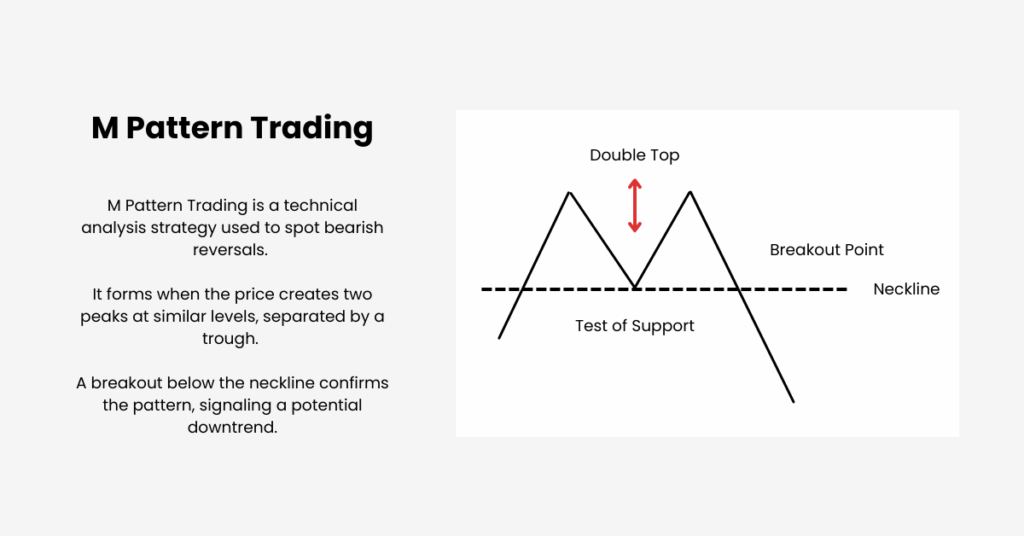
The M pattern, also known as the double top, is a bearish reversal chart formation that consists of two peaks at roughly the same price level, separated by a trough.
When the price breaks below the trough (neckline), it confirms the reversal and signals that the uptrend is losing strength, likely followed by a downtrend.
The main components include:
First Peak: The price rises to a high point before pulling back.
Neckline: The horizontal line connecting the lows between the peaks, acting as support.
Second Peak: The price rises again but fails to break above the first peak, signaling weakening buying momentum.
Breakdown: When the price breaks below the neckline, it confirms the pattern and indicates a bearish reversal.
How to Identify the M Pattern

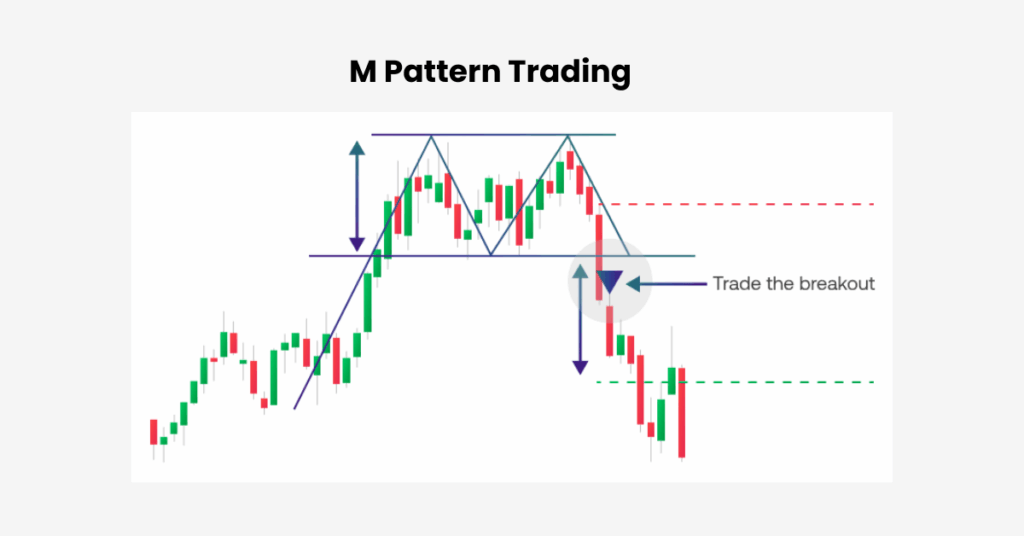
Spotting the M pattern is straightforward. Look for two peaks at nearly the same level, with a pullback (the trough) in between. The pattern is confirmed when the price breaks below the neckline, signaling the end of the uptrend and the beginning of a possible downtrend.
A useful technique is to combine the pattern with candlestick charts, which can help you gauge the strength of the trend. Strong green candles indicate buying pressure at the first peak, while smaller candles or a shift to red candles at the second peak suggest the trend is weakening.
Avoiding False Signals
One of the biggest challenges when trading the M pattern is avoiding false signals. Sometimes the pattern can appear, but the price may not actually reverse. To reduce this risk, it’s essential to confirm the pattern with other indicators, such as volume or momentum oscillators like the MACD. A strong breakdown below the neckline, supported by increased volume, adds reliability to the signal.
Using proper risk management strategies, such as placing stop-loss orders just above the second peak, will also help protect you from false breakouts and unexpected market movements.
How to Navigate the M Pattern Trading
Once you’ve identified the M pattern, here’s how to trade it effectively:
First, confirm the pattern by looking for two peaks at nearly the same level. The second peak should be slightly lower, showing that buying momentum is fading. Draw the neckline at the lowest point between the peaks. The pattern is confirmed when the price breaks below the neckline, signaling a potential bearish reversal.
For a stronger confirmation, combine the M pattern with Fibonacci retracements. After the price breaks below the neckline, look for a pullback to key Fibonacci levels like 61.8% before entering the trade. This retracement gives you a better entry point before the price continues to fall.
Once you’ve entered, place your stop-loss just above the second peak to protect against false breakouts. For take-profit, measure the height of the pattern (from the first peak to the neckline) and project that distance downward from the breakout point.
Example of the M Pattern Trading with Fibonacci
Let’s consider an example:
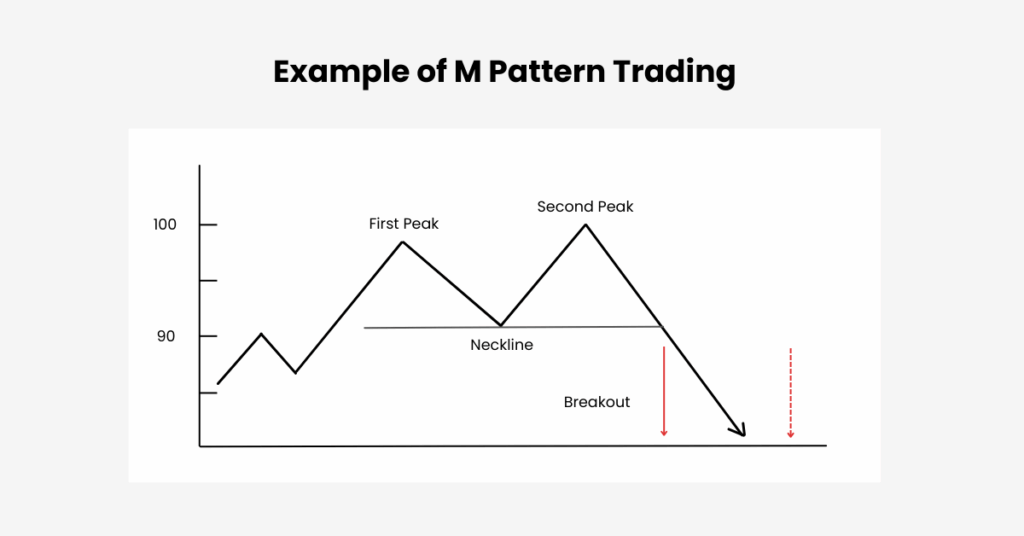
First Peak: The price rises to $100.
Trough: The price falls to $90, marking the low of the pattern.
Second Peak: The price rises to $95 but doesn’t break $100.
Breakout: The price breaks below $90, confirming the M pattern.

At this point, apply the Fibonacci retracement tool from the second peak ($95) to the trough ($90). If the price retraces to the 61.8% Fibonacci level at $92.50, enter your trade. Set your stop-loss at $96 and target a take-profit at $80, based on the pattern’s height.
Key Takeaways
The M pattern (double top) is an effective tool for identifying bearish reversals. To trade it successfully:
- Look for two peaks at roughly the same level, separated by a trough.
- Draw the neckline and wait for a break below it.
- Combine the M pattern with Fibonacci retracements, candlestick analysis, and other indicators for confirmation.
- Use good risk management practices to protect your position.
By following these steps, you’ll be able to conduct M pattern trading with greater confidence, giving you an edge in bearish market conditions.
Disclaimer: This content is provided for informational purposes only and does not constitute, and should not be construed as, financial, investment, or other professional advice. No statement or opinion contained here in should be considered a recommendation by Ultima Markets or the author regarding any specific investment product, strategy, or transaction. Readers are advised not to rely solely on this material when making investment decisions and should seek independent advice where appropriate.


