This website is managed by Ultima Markets’ international entities, and it’s important to emphasise that they are not subject to regulation by the FCA in the UK. Therefore, you must understand that you will not have the FCA’s protection when investing through this website – for example:
You will not be guaranteed Negative Balance Protection
You will not be protected by FCA’s leverage restrictions
You will not have the right to settle disputes via the Financial Ombudsman Service (FOS)
You will not be protected by Financial Services Compensation Scheme (FSCS)
Any monies deposited will not be afforded the protection required under the FCA Client Assets Sourcebook. The level of protection for your funds will be determined by the regulations of the relevant local regulator.
Note: UK clients are kindly invited to visit https://www.ultima-markets.co.uk/. Ultima Markets UK expects to begin onboarding UK clients in accordance with FCA regulatory requirements in 2026.
If you would like to proceed and visit this website, you acknowledge and confirm the following:
1.The website is owned by Ultima Markets’ international entities and not by Ultima Markets UK Ltd, which is regulated by the FCA.
2.Ultima Markets Limited, or any of the Ultima Markets international entities, are neither based in the UK nor licensed by the FCA.
3.You are accessing the website at your own initiative and have not been solicited by Ultima Markets Limited in any way.
4.Investing through this website does not grant you the protections provided by the FCA.
5.Should you choose to invest through this website or with any of the international Ultima Markets entities, you will be subject to the rules and regulations of the relevant international regulatory authorities, not the FCA.
Ultima Markets wants to make it clear that we are duly licensed and authorised to offer the services and financial derivative products listed on our website. Individuals accessing this website and registering a trading account do so entirely of their own volition and without prior solicitation.
By confirming your decision to proceed with entering the website, you hereby affirm that this decision was solely initiated by you, and no solicitation has been made by any Ultima Markets entity.
Ultima Markets does not have an establishment in Singapore and does not operate from Singapore.
Ultima Markets does not provide products or services to citizens or residents of Singapore, and account applications from Singapore citizens or residents will not be accepted.
If you are a citizen or resident of Singapore, please do not open an account or use Ultima Markets’ products or services.
By selecting “Acknowledge and Continue Browsing”, you confirm that you are accessing this website on your own initiative and that your access is not the result of any direct marketing, targeted advertising, solicitation, or promotional activity by Ultima Markets.
Nothing on this website constitutes an offer, solicitation, or promotion of products or services in any jurisdiction where such activity is prohibited. You are responsible for ensuring that your access to and use of this website complies with applicable local laws and regulations.
Learn how Efficiency Ratios like Asset Turnover and Working Capital Turnover help forex traders make informed trading decisions
As a forex trader, understanding financial ratios is crucial for assessing the performance of companies, especially if you’re analyzing stocks, commodities, or any asset class related to forex trading.
One key metric to consider is the Efficiency Ratio, a measure that helps evaluate how well a company utilizes its resources to generate sales or revenue.
What is the Efficiency Ratio?
The Efficiency Ratio is a financial metric used to assess a company’s operational effectiveness in generating revenue from its assets, inventory, receivables, and payables. As a forex trader, you might encounter this ratio when analyzing stocks or other financial instruments, as it reveals how well a company is managing its operational resources to drive sales.
Efficiency Ratio Types
Each Efficiency Ratio has a unique focus and importance, depending on the company’s sector and operations. Here’s a breakdown of the key ratios:
Asset Turnover Ratio: A higher ratio indicates that a company is using its assets efficiently to generate revenue. This is particularly useful when analyzing stocks in industries where capital investment is high, such as technology or manufacturing.
Inventory Turnover Ratio: A high inventory turnover ratio suggests that a company is efficiently managing its stock, which can indicate strong demand for its products. As a forex trader, analyzing this ratio can help gauge the health of companies involved in retail, e-commerce, or consumer goods.
Receivables Turnover Ratio: A high ratio shows that a company is efficiently collecting on its credit sales. This is a good indicator of financial health, especially for businesses that rely heavily on credit transactions.
Payables Turnover Ratio: A higher ratio means a company is paying its suppliers more quickly. For a forex trader, this can offer insights into a company’s liquidity and cash flow management.
Working Capital Turnover Ratio: A higher ratio suggests that a company is effectively using its working capital to generate sales, indicating strong operational efficiency.
Efficiency Ratio Formula and Calculation
Each type of Efficiency Ratio uses a slightly different formula. Here’s an overview of the key ratios and how they’re calculated:
Asset Turnover Ratio
Measures how efficiently a company generates revenue from its assets.
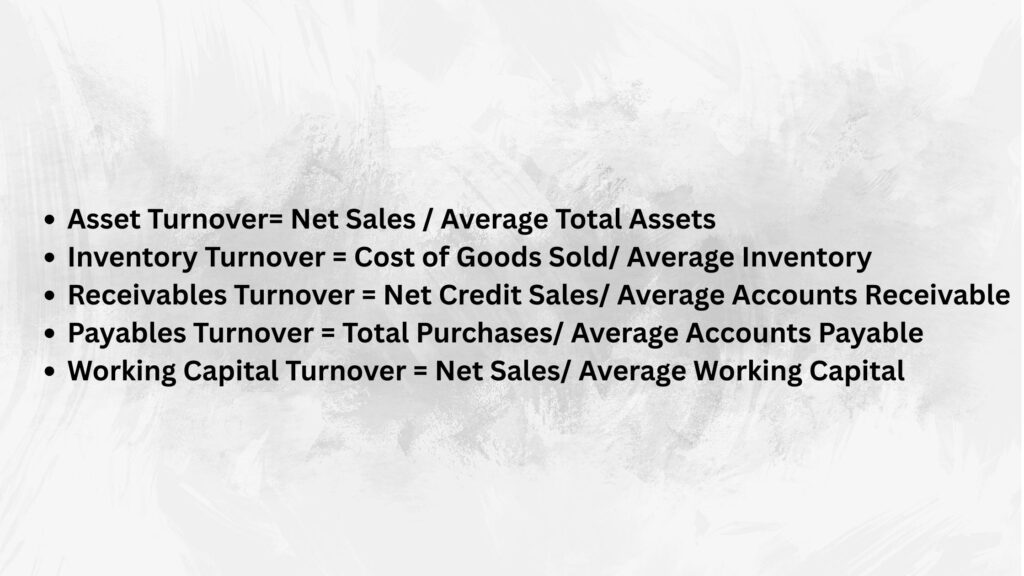
Asset Turnover= Net Sales / Average Total Assets
Example: If a company has net sales of $1,000,000 and average total assets of $500,000, the asset turnover ratio is: $1,000,000/ $500,000 = 2
This means the company generates $2 in sales for every $1 of assets it owns. As a forex trader, you could use this metric to evaluate how efficiently a company is deploying its assets, which is especially useful when trading stocks or other asset-backed instruments
Inventory Turnover Ratio
Shows how quickly a company sells and replaces its inventory, which can be crucial for companies in industries with high inventory levels.
Inventory Turnover = Cost of Goods Sold/ Average Inventory
Example: If a company has cost of goods sold (COGS) of $400,000 and average inventory of $50,000, the inventory turnover ratio is: $400,000/$50,000 = 8
This means the company sells and replaces its inventory 8 times in a year.
Receivables Turnover Ratio
This ratio measures how effectively a company collects its credit sales.
Receivables Turnover = Net Credit Sales/ Average Accounts Receivable
Payables Turnover Ratio
Indicates how quickly a company pays off its suppliers.
Payables Turnover = Total Purchases/ Average Accounts Payable
Working Capital Turnover Ratio
Measures how efficiently a company uses its working capital to generate sales.
Working Capital Turnover = Net Sales/ Average Working Capital
What is a Good Efficiency Ratio?
A “good” Efficiency Ratio can vary by industry. Generally, higher ratios are better, as they indicate that the company is using its resources more effectively. However, it’s essential to compare these ratios to industry averages and peer companies.
For example, a high Asset Turnover Ratio might be considered good in industries like retail or manufacturing but could be less relevant in capital-intensive industries like utilities.
Let’s consider Apple Inc. (AAPL), a popular stock among forex and stock traders. We’ll focus on its Asset Turnover Ratio to illustrate how the ratio works in practice.
Example: Asset Turnover Ratio for Apple
Net Sales: $365.8 billion (for the most recent fiscal year)
Average Total Assets: $384.6 billion
Asset Turnover Ratio Formula: Asset Turnover = Net Sales/ Average Total Assets
Calculating for Apple Asset Turnover Ratio = 365.8billion/ 384.6 billion = 0.95
This means that Apple generates approximately $0.95 in sales for every $1 of assets it holds.
Is 0.95 a Good Efficiency Ratio for Apple?
For a company like Apple, which has a vast asset base (including its physical stores, research & development facilities, and technology), a ratio of 0.95 is quite good, indicating that the company is effectively using its resources to generate revenue. It shows that Apple is efficiently using its assets relative to its size, a positive sign for investors and traders.
However, what is considered a good ratio can vary:
Technology companies like Apple often have a lower Asset Turnover Ratio compared to industries like retail, where companies usually have high sales with lower asset bases.
For retail companies like Walmart or Amazon, the ratio could be much higher, often above 2.0, because they operate on thin margins and rely heavily on inventory turnover.
If you’re trading stocks or assets linked to a company, monitoring Efficiency Ratios like the Asset Turnover Ratio can give you insights into how well a company is utilizing its resources to generate revenue. For stocks like Apple, a ratio of 0.95 may be seen as efficient, while you might expect a higher ratio from a fast-paced consumer goods company with high sales volumes.
How to Calculate Efficiency Ratios for Trading
To calculate Efficiency Ratios, follow these simple steps:
Choose the appropriate ratio for the financial aspect you’re analyzing (e.g., Asset Turnover, Inventory Turnover).
Gather data: Ensure you have the correct financial data, such as net sales, average assets, or inventory levels.
Apply the formula: Use the formulas mentioned above for the specific ratio you’re calculating.
Interpret the results: Compare the calculated ratio with industry benchmarks or historical performance to assess efficiency.
By incorporating these ratios into your trading strategy, you can gain valuable insights into the companies you trade, helping you make more informed decisions.
Conclusion
At Ultima Markets, we understand the importance of Efficiency Ratios in identifying potential trading opportunities. As a trusted, regulated broker, Ultima Markets provides access to a diverse range of CFDs (Contracts for Difference), allowing traders to engage with global equities, commodities, and forex pairs. By integrating efficiency ratios into your analysis, you can evaluate the operational strength of the companies behind the assets you are trading.
When you trade with Ultima Markets, you can leverage detailed market data, including efficiency ratios, to assess the financial performance of the underlying assets you are trading. For example, you could examine how the Working Capital Turnover Ratio of a company influences its ability to handle short-term obligations or manage its working capital efficiently, crucial information for forex traders making timely decisions on currency pairs or stock CFDs.
Remember, a good Efficiency Ratio can vary depending on the industry. Always compare a company’s ratio with industry averages to get a more accurate understanding of its operational efficiency. This approach allows you to identify undervalued or overvalued assets, enabling smarter trading choices.
Share Now
Disclaimer:This content is provided for informational purposes only and does not constitute, and should not be construed as, financial, investment, or other professional advice. No statement or opinion contained herein should be considered a recommendation by Ultima Markets or the author regarding any specific investment product, strategy, or transaction. Readers are advised not to rely solely on this material when making investment decisions and should seek independent advice where appropriate.
Thank you for visiting the Ultima Markets website. Please note that this website is intended for individuals residing in jurisdictions where access is permitted by law. Ultima and its affiliated entities do not operate in your home jurisdiction.
By clicking ‘Acknowledge’, you confirm that you are entering this website solely on your own initiative and not as a result of any specific marketing outreach. You wish to obtain information from this website based on reverse solicitation principles, in accordance with the applicable laws of your home jurisdiction.