
Ultima Markets App
Trade Anytime, Anywhere
Important Information
This website is managed by Ultima Markets’ international entities, and it’s important to emphasise that they are not subject to regulation by the FCA in the UK. Therefore, you must understand that you will not have the FCA’s protection when investing through this website – for example:
- You will not be guaranteed Negative Balance Protection
- You will not be protected by FCA’s leverage restrictions
- You will not have the right to settle disputes via the Financial Ombudsman Service (FOS)
- You will not be protected by Financial Services Compensation Scheme (FSCS)
- Any monies deposited will not be afforded the protection required under the FCA Client Assets Sourcebook. The level of protection for your funds will be determined by the regulations of the relevant local regulator.
Note: Ultima Markets is currently developing a dedicated website for UK clients and expects to onboard UK clients under FCA regulations in 2026.
If you would like to proceed and visit this website, you acknowledge and confirm the following:
- 1.The website is owned by Ultima Markets’ international entities and not by Ultima Markets UK Ltd, which is regulated by the FCA.
- 2.Ultima Markets Limited, or any of the Ultima Markets international entities, are neither based in the UK nor licensed by the FCA.
- 3.You are accessing the website at your own initiative and have not been solicited by Ultima Markets Limited in any way.
- 4.Investing through this website does not grant you the protections provided by the FCA.
- 5.Should you choose to invest through this website or with any of the international Ultima Markets entities, you will be subject to the rules and regulations of the relevant international regulatory authorities, not the FCA.
Ultima Markets wants to make it clear that we are duly licensed and authorised to offer the services and financial derivative products listed on our website. Individuals accessing this website and registering a trading account do so entirely of their own volition and without prior solicitation.
By confirming your decision to proceed with entering the website, you hereby affirm that this decision was solely initiated by you, and no solicitation has been made by any Ultima Markets entity.
I confirm my intention to proceed and enter this website Please direct me to the website operated by Ultima Markets , regulated by the FCA in the United Kingdom

What Is Solvency Ratio?
The solvency ratio is a key measure of a company’s ability to meet its long-term financial obligations. Unlike liquidity ratios, which focus on short-term payments, the solvency ratio looks at overall financial stability.
In corporate finance, the solvency ratio is usually calculated by dividing net income plus depreciation by total liabilities. In the insurance sector, regulators use a different version that compares available capital against required solvency margins. Both versions aim to answer the same question: can the organisation survive in the long run?

Why Solvency Ratio Matters
A strong solvency ratio reassures investors, creditors, and regulators that the company can honour its commitments well into the future. Lenders often use it to decide on credit approvals, while investors rely on it to compare the financial health of different companies. For insurers, regulators require a minimum solvency ratio to protect policyholders from the risk of default.
How to Calculate Solvency Ratio
The corporate formula is straightforward:
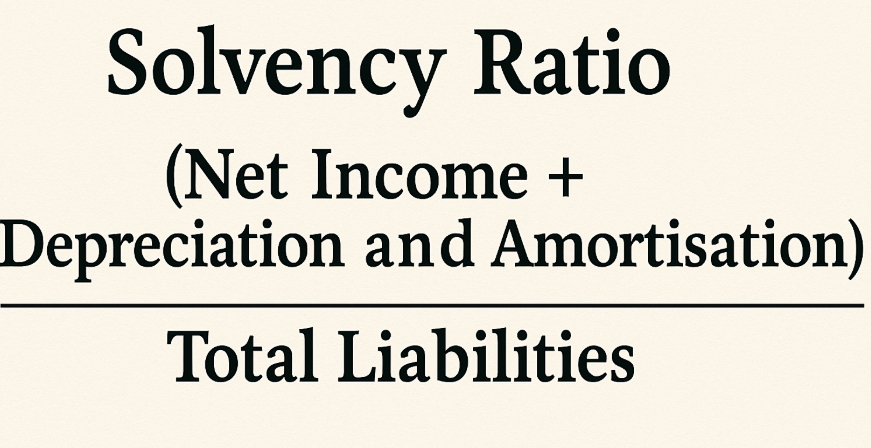
Solvency Ratio = (Net Income + Depreciation and Amortisation) ÷ Total Liabilities
This version uses earnings plus non-cash expenses, showing how much recurring income is available to cover liabilities.
In the insurance industry, the calculation is defined as:
Solvency Ratio = Available Solvency Margin ÷ Required Solvency Margin
This approach focuses on whether insurers hold enough admissible assets to meet regulatory capital requirements.
What Is a Good Solvency Ratio?
In general corporate finance, a solvency ratio above 20% is considered healthy. This level suggests that the company generates sufficient earnings to cover its liabilities and still maintain financial flexibility.
For insurance firms, the benchmark is much higher. In India, for example, the IRDAI requires insurers to maintain a solvency ratio of at least 150%. Many insurers aim for an even higher figure to demonstrate financial resilience.
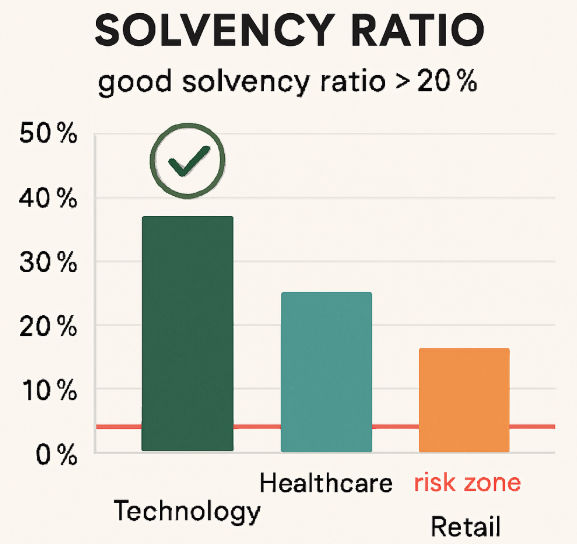
Here’s another example (based on image above):
- Technology stands out with a 40% solvency ratio, well above the 20% benchmark, highlighted with a green checkmark to signal strong financial health.
- Healthcare hovers right at the 20% line, showing acceptable but cautious stability.
- Retail dips just below 20%, landing in the “risk zone” marked in red, indicating potential financial strain.
Solvency Ratio Example
Imagine a company reporting net income of $45 million, depreciation of $15 million, and total liabilities of $243 million.
Applying the formula gives: (45 + 15) ÷ 243 = 24.6%
A result of 24.6% indicates strong long-term solvency, comfortably above the 20% threshold.
Types of Solvency Ratios
In practice, analysts use several ratios to build a full picture of solvency. Common measures include the debt-to-assets ratio, the debt-to-equity ratio, the equity ratio, and the interest coverage ratio. Each provides a slightly different perspective on leverage and debt-servicing ability, and together they form a more reliable assessment than a single metric.
Analysts often check more than one ratio to measure long-term stability:
- Debt-to-Assets Ratio = Total Debt ÷ Total Assets
- Debt-to-Equity Ratio = Total Debt ÷ Shareholders’ Equity
- Equity Ratio = Equity ÷ Total Assets
- Interest Coverage Ratio = EBIT ÷ Interest Expense (above 1.5× is generally healthy)
Solvency Ratio vs Liquidity Ratio
Although solvency and liquidity ratios are related, they serve different purposes. Solvency ratios look at the ability to survive long term, while liquidity ratios focus on whether the company can pay its bills in the short term. A business may appear liquid but still face solvency issues if it cannot sustain debt repayment over several years.
Conclusion
Understanding the solvency ratio is essential for anyone analysing the long-term health of a company. Whether you are comparing corporate giants, evaluating insurers, or simply learning how financial stability is measured, this ratio provides a clear picture of resilience and risk.
At Ultima Markets, we believe informed traders make better decisions. That’s why we share educational resources to help you understand financial concepts like solvency, liquidity, and risk management. As a multi-regulated broker committed to transparency, our goal is to provide a secure trading environment while equipping you with the knowledge to navigate global markets confidently.
Disclaimer: This content is provided for informational purposes only and does not constitute, and should not be construed as, financial, investment, or other professional advice. No statement or opinion contained here in should be considered a recommendation by Ultima Markets or the author regarding any specific investment product, strategy, or transaction. Readers are advised not to rely solely on this material when making investment decisions and should seek independent advice where appropriate.
Latest Articles


FOLLOW US


Ultima Markets is a member of The Financial Commission, an international independent body responsible for resolving disputes in the Forex and CFD markets.
All clients of Ultima Markets are protected under insurance coverage provided by Willis Towers Watson (WTW), a global insurance brokerage established in 1828, with claims eligibility up to US$1,000,000 per account.
Ultima Markets is the first United CFD broker to be part of the United Nations Global Compact.
FOLLOW US
TRADE WITH US
RISK DISCLOSURE
Risk Warning:
Trading leveraged financial products, including Contracts for Difference (CFDs), carries a high level of risk and may result in losses exceeding your initial investment. These products are not suitable for all investors and should only be traded with funds you can afford to lose. You do not own or have any rights to the underlying assets of these derivatives (e.g., entitlement to dividends). Please ensure you fully understand the associated risks. Before trading, consider your level of experience, investment objectives, and seek independent financial advice if necessary. Refer to our legal documents and disclosures before making any trading decisions.
General Advice Warning:
The information provided on this website is general in nature and does not take into account your personal objectives, financial situation, or needs. Before acting on any advice, you should assess its appropriateness in light of your individual circumstances and consult our legal documentation.
Regional Restrictions:
The information and services on this website are not intended for residents of certain jurisdictions, including but not limited to the United States, United Kingdom, Singapore, and any jurisdictions subject to international sanctions. For further information, please contact our customer support team.
Regulatory Information:
Ultima Markets is a trading name shared amongst multiple entities operating in various jurisdictions. These following entities are authorised to operate under the Ultima Markets brand and trademarks.
-
Ultima Markets UK Limited, reference number 470325, is authorised and regulated by the Financial Conduct Authority (FCA). Registered address: 1 Blossom Yard, Fourth Floor, London, E1 6RS, UNITED KINGDOM.
-
Ultima Markets Ltd is authorised and regulated by the Financial Services Commission (FSC) of Mauritius as a Full-Service Investment Dealer (excluding Underwriting), under licence number GB 23201593.
Registered address: 2nd Floor, The Catalyst, 40 Silicon Avenue, Ebene Cybercity, 72201, Mauritius.
Copyright © 2026 Ultima Markets Ltd. All rights reserved.
-

Messenger


Continue on Messenger
Take the conversation to your Messenger account. You can return anytime.
Scan the QR code and then send the message that appears in your Messenger.
Open Messenger on this device.
-

Instagram

Continue on Instagram
Take the conversation to your Instagram account. You can return anytime.
Scan the QR code to open Instagram. Follow @ultima_markets to send a DM.
Open Instagram on this device.
-

Live Chat
-
