This website is managed by Ultima Markets’ international entities, and it’s important to emphasise that they are not subject to regulation by the FCA in the UK. Therefore, you must understand that you will not have the FCA’s protection when investing through this website – for example:
You will not be guaranteed Negative Balance Protection
You will not be protected by FCA’s leverage restrictions
You will not have the right to settle disputes via the Financial Ombudsman Service (FOS)
You will not be protected by Financial Services Compensation Scheme (FSCS)
Any monies deposited will not be afforded the protection required under the FCA Client Assets Sourcebook. The level of protection for your funds will be determined by the regulations of the relevant local regulator.
Note: UK clients are kindly invited to visit https://www.ultima-markets.co.uk/. Ultima Markets UK expects to begin onboarding UK clients in accordance with FCA regulatory requirements in 2026.
If you would like to proceed and visit this website, you acknowledge and confirm the following:
1.The website is owned by Ultima Markets’ international entities and not by Ultima Markets UK Ltd, which is regulated by the FCA.
2.Ultima Markets Limited, or any of the Ultima Markets international entities, are neither based in the UK nor licensed by the FCA.
3.You are accessing the website at your own initiative and have not been solicited by Ultima Markets Limited in any way.
4.Investing through this website does not grant you the protections provided by the FCA.
5.Should you choose to invest through this website or with any of the international Ultima Markets entities, you will be subject to the rules and regulations of the relevant international regulatory authorities, not the FCA.
Ultima Markets wants to make it clear that we are duly licensed and authorised to offer the services and financial derivative products listed on our website. Individuals accessing this website and registering a trading account do so entirely of their own volition and without prior solicitation.
By confirming your decision to proceed with entering the website, you hereby affirm that this decision was solely initiated by you, and no solicitation has been made by any Ultima Markets entity.
Learn how the Aroon Indicator works, including its formula, calculation, and strategies for spotting trends, breakouts, and reversals to upscale your trades
Aroon Indicator Explained: How to Use It?
Traders often miss the first turn when a market shifts from range to trend. The Aroon Indicator helps close that gap by measuring how recently price set a high or a low, turning time into a clear read on trend direction and strength.
This article will explain how the Aroon Indicator works, the standard settings and signals, how to spot emerging trends and reversals, and the common mistakes to avoid so you can use it with confidence.
What is Aroon Indicator?
The Aroon Indicator is a technical analysis tool developed by Tushar Chande in 1995. Its main purpose is to help traders determine if a market is trending and to measure the strength of that trend. What makes the Aroon unique is that it focuses on time elapsed since the last price high or low, rather than just price movements. This allows traders to spot emerging trends and potential reversals earlier than with many other indicators.
How It Works
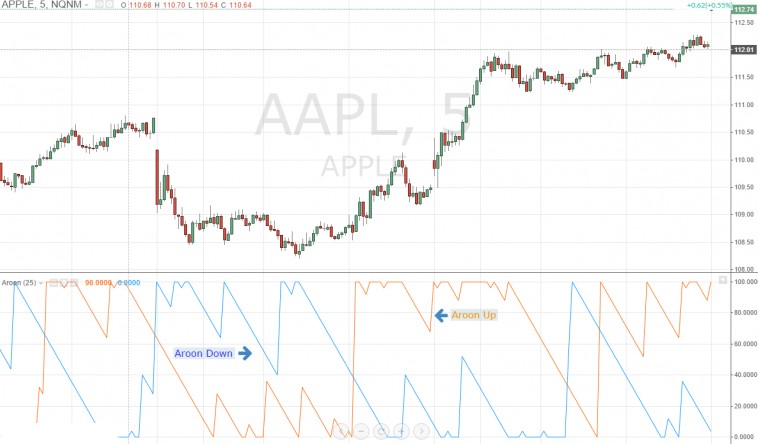
The Aroon consists of two separate lines:
Aroon Up: Tracks how many periods have passed since the most recent high.
If the most recent high happened very recently, the value will be close to 100. If the market hasn’t set a new high for many periods, the value drops toward 0.
Aroon Down: Tracks how many periods have passed since the most recent low.
If the most recent low occurred just a few periods ago, Aroon Down will be near 100. If the market hasn’t made a new low for a long time, the value will decline toward 0.
Both lines oscillate between 0 and 100, making it simple to interpret trend conditions.
Why It’s Useful
Trend detection: If Aroon Up stays high while Aroon Down remains low, it signals a strong uptrend. The opposite is true for a downtrend.
Strength measurement: The closer a line is to 100, the more recent the high/low, which suggests stronger momentum in that direction.
Early signals: Because the Aroon measures time since highs/lows, it can often warn of a trend shift before price-based momentum indicators like RSI or MACD.
Aroon Indicator Formula and Calculation
The Aroon Indicator is calculated using two formulas — one for Aroon Up and one for Aroon Down. Both are based on the number of periods chosen (commonly 25 in its original design, though some platforms use 14).
Aroon Up = ((N − Periods since highest high) / N) × 100
Aroon Down = ((N − Periods since lowest low) / N) × 100
Where:
N = number of periods in the chosen lookback window (e.g., 25 days)
Periods since highest high = how many candles ago the most recent high occurred
Periods since lowest low = how many candles ago the most recent low occurred
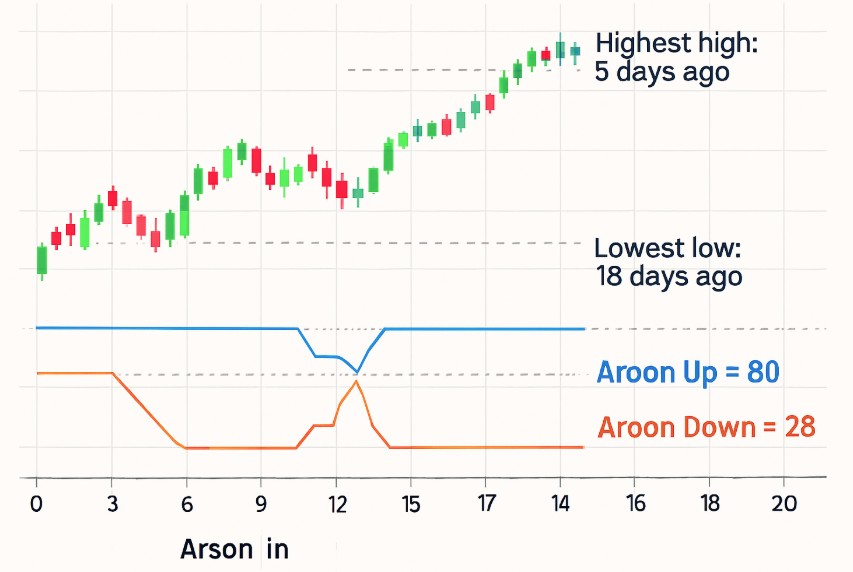
Step-by-Step Example
Imagine you are using a 25-day Aroon Indicator on a stock chart:
Look back over the last 25 days.
Identify the highest high during that period, suppose it occurred 5 days ago.
Plug into the formula: Aroon Up = ((25 − 5) ÷ 25) × 100 = (20 ÷ 25) × 100 = 80. This means the most recent high was fairly recent, suggesting bullish momentum.
Identify the lowest low during the same 25-day window. Suppose it occurred 18 days ago.
Plug into the formula: Aroon Down = ((25 − 18) ÷ 25) × 100 = (7 ÷ 25) × 100 = 28. This low happened further back, so bearish pressure is weaker.
In this scenario, Aroon Up = 80 and Aroon Down = 28 → indicating the market is leaning bullish.
How to Interpret the Values
100: The high/low happened in the current period (very strong signal).
Near 70–100: Strong trend direction (recent high or low).
Near 50: Neutral, no new highs or lows in about half the lookback period.
Near 0: The high/low happened at the very beginning of the lookback period (weak relevance now).
How to Use the Aroon Indicator in Trading
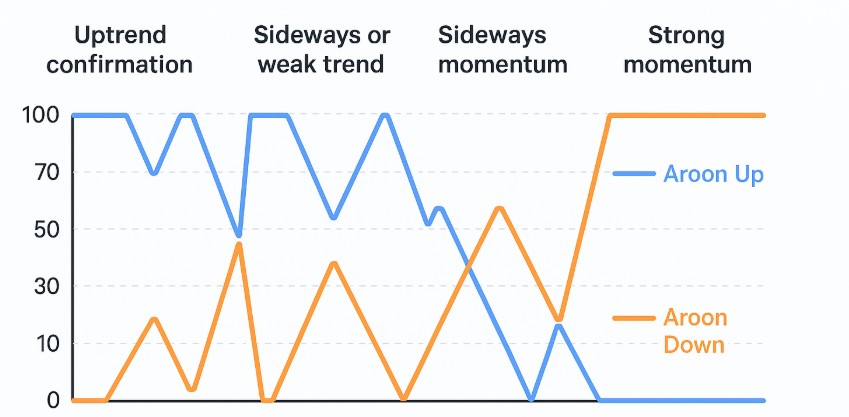
Traders rely on the Aroon to confirm trends and spot reversals. Common interpretations include:
Uptrend confirmation: Aroon Up stays above 70 while Aroon Down remains below 30.
Downtrend confirmation: Aroon Down stays above 70 while Aroon Up remains below 30.
Sideways or weak trend: Both lines hover near 50, suggesting no recent highs or lows and possible consolidation.
Strong momentum: A line near 100 signals a very recent high (or low), pointing to persistent trend strength.
Since the Aroon can produce false signals in choppy markets, traders often combine it with tools like moving averages, support and resistance, or volume indicators.
Aroon Indicator Strategy for Traders
The Aroon Indicator can be applied in different ways depending on whether a trader wants to follow trends, confirm breakouts, or anticipate reversals. Here’s a deeper look at how to use it:
Trend-Following Strategy
The most common use of the Aroon is to ride established trends.
Bullish setup: Enter long when Aroon Up crosses above Aroon Down and stays above 70. This shows that recent highs are being made more frequently than lows, confirming bullish strength.
Bearish setup: Enter short when Aroon Down crosses above Aroon Up and remains above 70. This indicates that lows are occurring more often, pointing to bearish dominance.
Breakout Confirmation
Breakouts can be tricky because many turn out to be false breakouts. The Aroon adds a layer of confirmation:
Look for chart patterns like triangles, flags, or trading ranges.
When price breaks out, check the Aroon: If the breakout is upward and Aroon Up is above 70 while Aroon Down is below 30, the move is likely genuine. If the breakout is downward and Aroon Down is strong while Aroon Up weakens, the downside move has credibility.
Reversal Detection
The Aroon can also spot when a trend is losing momentum, offering traders an early signal to prepare for reversals.
If Aroon Up starts falling while Aroon Down begins rising, it may mean the bullish trend is weakening and bears are taking control.
Conversely, if Aroon Down declines and Aroon Up climbs, it suggests bearish momentum is fading and bulls may return.
Sideways Market Recognition
Traders often get chopped up in sideways ranges. The Aroon helps identify when to stay out.
If both lines hover around 50, it means neither highs nor lows are being set consistently — the market is consolidating.
This is usually a sign to wait for a breakout before committing to a trade.
Multi-Timeframe Strategy
Professional traders often combine the Aroon on different timeframes:
Use a longer timeframe (daily/weekly) Aroon to identify the dominant trend.
Use a shorter timeframe (hourly/4H) Aroon to fine-tune entries and exits.
Advantages and Limitations of the Aroon Indicator
Advantages
Detects trend shifts earlier than many lagging indicators.
Easy to interpret with crossover and level signals.
Applicable to multiple markets, stocks, forex, crypto, and commodities.
Limitations
Generates false signals in sideways or low-volatility conditions.
Best used with other indicators for confirmation.
Conclusion
The Aroon Indicator is a versatile tool that helps traders measure trend strength, confirm breakouts, and anticipate reversals. By understanding its formula, signals, and strategies, traders can make more informed decisions and avoid being caught off guard by market shifts.
Originally designed for a 25-period lookback, the Aroon can also be adapted to shorter settings like 14 depending on trading style. When paired with sound risk management and complementary tools, it becomes a powerful part of any trader’s technical analysis toolkit.
At Ultima Markets, we go beyond providing a trading platform, we deliver the education, insights, and resources you need to apply indicators with confidence. From advanced charting tools to our UM Academy learning hub, we equip traders of all levels to trade smarter, manage risk effectively, and seize opportunities in global markets.
Share Now
Disclaimer:This content is provided for informational purposes only and does not constitute, and should not be construed as, financial, investment, or other professional advice. No statement or opinion contained herein should be considered a recommendation by Ultima Markets or the author regarding any specific investment product, strategy, or transaction. Readers are advised not to rely solely on this material when making investment decisions and should seek independent advice where appropriate.
Thank you for visiting the Ultima Markets website. Please note that this website is intended for individuals residing in jurisdictions where access is permitted by law. Ultima and its affiliated entities do not operate in your home jurisdiction.
By clicking ‘Acknowledge’, you confirm that you are entering this website solely on your own initiative and not as a result of any specific marketing outreach. You wish to obtain information from this website based on reverse solicitation principles, in accordance with the applicable laws of your home jurisdiction.