This website is managed by Ultima Markets’ international entities, and it’s important to emphasise that they are not subject to regulation by the FCA in the UK. Therefore, you must understand that you will not have the FCA’s protection when investing through this website – for example:
You will not be guaranteed Negative Balance Protection
You will not be protected by FCA’s leverage restrictions
You will not have the right to settle disputes via the Financial Ombudsman Service (FOS)
You will not be protected by Financial Services Compensation Scheme (FSCS)
Any monies deposited will not be afforded the protection required under the FCA Client Assets Sourcebook. The level of protection for your funds will be determined by the regulations of the relevant local regulator.
Note: UK clients are kindly invited to visit https://www.ultima-markets.co.uk/. Ultima Markets UK expects to begin onboarding UK clients in accordance with FCA regulatory requirements in 2026.
If you would like to proceed and visit this website, you acknowledge and confirm the following:
1.The website is owned by Ultima Markets’ international entities and not by Ultima Markets UK Ltd, which is regulated by the FCA.
2.Ultima Markets Limited, or any of the Ultima Markets international entities, are neither based in the UK nor licensed by the FCA.
3.You are accessing the website at your own initiative and have not been solicited by Ultima Markets Limited in any way.
4.Investing through this website does not grant you the protections provided by the FCA.
5.Should you choose to invest through this website or with any of the international Ultima Markets entities, you will be subject to the rules and regulations of the relevant international regulatory authorities, not the FCA.
Ultima Markets wants to make it clear that we are duly licensed and authorised to offer the services and financial derivative products listed on our website. Individuals accessing this website and registering a trading account do so entirely of their own volition and without prior solicitation.
By confirming your decision to proceed with entering the website, you hereby affirm that this decision was solely initiated by you, and no solicitation has been made by any Ultima Markets entity.
Supercharge your trading with the Parabolic SAR indicator. Learn to identify trend shifts and make smarter trades to gain a competitive edge in the market.
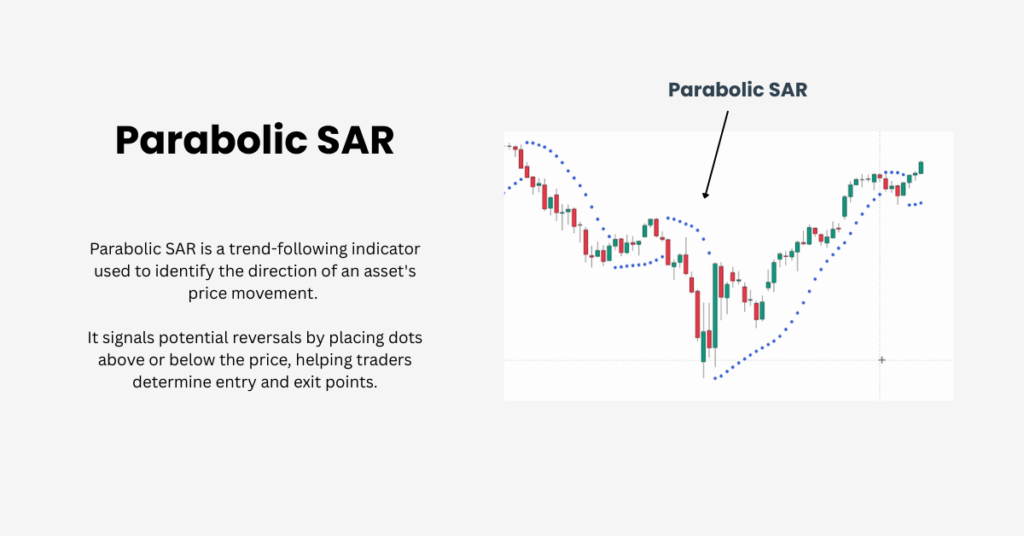
The Parabolic SAR Indicator is a widely-used technical indicator developed by J. Welles Wilder. It helps traders identify trend directions, spot potential reversals, and determine optimal entry and exit points.
While the Parabolic SAR (Stop and Reverse) is effective in trending markets, it must be used correctly to avoid false signals, particularly in sideways or choppy conditions. In this guide, we’ll break down how the Parabolic SAR works, how to set it up, and some advanced strategies to enhance your trading.
What Is the Parabolic SAR Indicator?
The Parabolic SAR is displayed as dots on a price chart. These dots appear below the price during an uptrend and above the price during a downtrend, helping the trader identify the direction of the trend.
The indicator’s purpose is to signal the end of one trend and the beginning of another, or to highlight potential entry and exit points. The Parabolic SAR helps traders follow market trends and make informed decisions based on technical analysis.
Primary Functions of Parabolic SAR:
Highlighting the Current Trend: The indicator helps traders spot the current market trend—whether bullish or bearish.
Entry Signals: An entry is signaled when the dots flip below the price, indicating the beginning of an uptrend.
Exit Signals: When the dots flip above the price, it’s a signal to exit the position or reverse the trade.
How the Parabolic SAR Indicator Functions
At its core, the Parabolic SAR uses two key components: the acceleration factor (AF) and the extreme point (EP). The extreme point refers to the highest price reached during an uptrend or the lowest price reached during a downtrend, while the acceleration factor is a value that increases incrementally—typically by 0.02—each time the price sets a new extreme point.
The way the Parabolic SAR works is by plotting a series of dots, known as SAR values, directly on the price chart. When these dots appear below the price bars, it signals a bullish trend, indicating that the market is in an uptrend. Conversely, when the dots are positioned above the price bars, it’s a bearish signal, suggesting a downtrend. This visual representation makes it easy for traders to quickly assess the current trend direction and anticipate potential reversals.
How to Trade with the Parabolic SAR
To effectively trade with the Parabolic SAR, it’s important to understand how to interpret its signals and integrate them into your broader trading strategy.
Identify Trend Direction:
Buy Signal: When the dots flip below the price, it signals the beginning of an uptrend.
Sell Signal: When the dots flip above the price, it indicates the start of a downtrend.
Combine with Price Action: While the Parabolic SAR indicator can give useful signals, it’s best combined with other indicators like candlestick patterns or price action. For example, after the SAR flips, look for confirmation like a bullish engulfing pattern or breakouts before entering a trade.
Adjust Stop-Loss Orders: The Parabolic SAR can also act as a trailing stop-loss. As new dots form, traders can move their stop-loss orders to lock in profits and protect against reversals.
Example of Parabolic SAR in Action
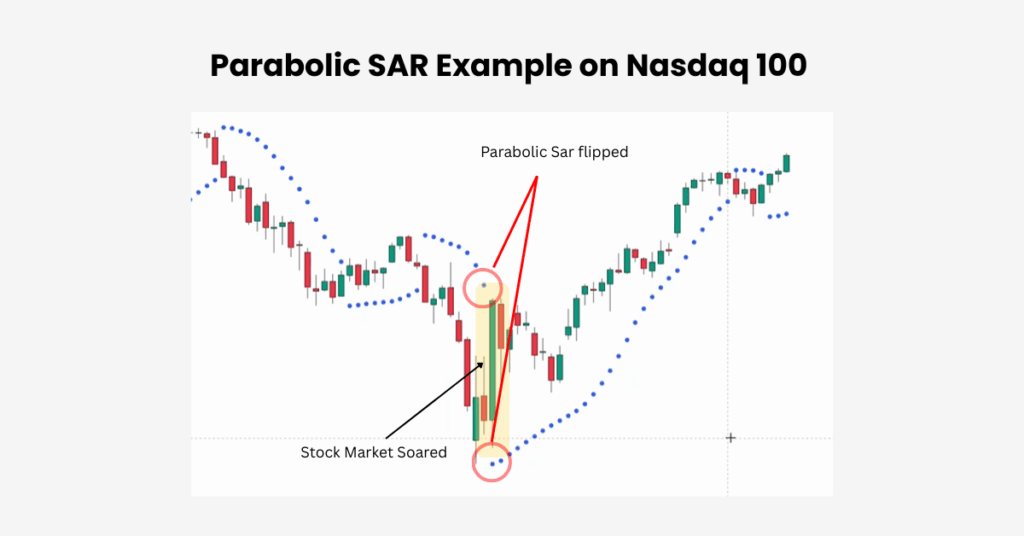
A great example of how the Parabolic SAR catches significant market movements can be seen during a massive price action on the NASDAQ 100. After a sharp market drop, the Parabolic SAR flipped from above the price to below it, signaling a trend reversal. This shift occurred after the market had fallen around 12%, marking the lowest point of a recent market crash.
Entry Signal: After the reversal, the Parabolic SAR caught several pullbacks, with dots moving below the price to confirm the uptrend.
Real-World Issue: While the indicator gave a clear signal after the flip, relying solely on this flip for entry could lead to false signals, especially in sideways markets. In the case of NASDAQ, after the reversal, a few pullbacks occurred that the Parabolic SAR successfully captured.
However, in sideways or consolidating markets, the Parabolic SAR may give frequent but false signals. For example, during periods of low volatility, the indicator can show many flips above and below the price, resulting in unprofitable trades.
This highlights the importance of combining the Parabolic SAR indicator with other indicators or confirmation signals to filter out those false entries and maximise profits.
Parabolic SAR and Risk Management
The Parabolic SAR also helps in risk management, especially when it comes to stop-loss placement. Here’s how to use it effectively:
Using SAR for Stop-Loss Placement: The Parabolic SAR can also help with stop-loss placement. If the trend reverses, and a new dot appears on the opposite side of the price, consider using that dot as your stop-loss point to exit the trade with minimal loss.
Avoiding False Signals: In sideways or consolidating markets, the Parabolic SAR can generate frequent signals that may not be reliable. This is especially true in ranging markets, where the indicator often produces false signals and premature reversals due to its sensitivity. The Parabolic SAR works best in a steady market, where trends are clear and stable. To reduce false signals, combine the Parabolic SAR with other indicators like the Relative Strength Index (RSI) or Moving Averages to confirm trends.
Pros and Cons of the Parabolic SAR
While the Parabolic SAR indicator is useful in identifying trends and reversals, it does have its fair share of advantages and drawbacks. Here’s a comparison:
Pros
Cons
Effective in strong trending markets
Less reliable in sideways or choppy markets
Provides clear entry and exit signals
Can generate false signals in low volatility or consolidating markets
Serves as a trailing stop-loss to lock in profits
Lagging indicator: signals can come late during rapid price changes
Can signal trend reversals effectively
Works best when combined with other indicators or price action to confirm trends
Conclusion
The Parabolic SAR indicator is an effective tool for identifying trends, potential reversals, and setting stop-loss orders. However, like all indicators, it is most effective when used in combination with other strategies, such as price action and trend confirmation indicators. By properly setting up and incorporating the Parabolic SAR into your trading plan, you can enhance your market timing and improve risk management, especially in trending conditions.
Disclaimer: This content is provided for informational purposes only and does not constitute, and should not be construed as, financial, investment, or other professional advice. No statement or opinion contained here in should be considered a recommendation by Ultima Markets or the author regarding any specific investment product, strategy, or transaction. Readers are advised not to rely solely on this material when making investment decisions and should seek independent advice where appropriate.
Thank you for visiting the Ultima Markets website. Please note that this website is intended for individuals residing in jurisdictions where accessing is permitted by law. Ultima and its affiliated entities do not operate in your home jurisdictions.
By clicking on ''Acknowledge'', you confirm that you are entering this website solely based on your initiative and not as a result of any specific marketing outreach. You wish to obtain information from this website based on reverse solicitation principles, in accordance with the applicable laws of your home jurisdiction.