


Important Information
This website is managed by Ultima Markets’ international entities, and it’s important to emphasise that they are not subject to regulation by the FCA in the UK. Therefore, you must understand that you will not have the FCA’s protection when investing through this website – for example:
- You will not be guaranteed Negative Balance Protection
- You will not be protected by FCA’s leverage restrictions
- You will not have the right to settle disputes via the Financial Ombudsman Service (FOS)
- You will not be protected by Financial Services Compensation Scheme (FSCS)
- Any monies deposited will not be afforded the protection required under the FCA Client Assets Sourcebook. The level of protection for your funds will be determined by the regulations of the relevant local regulator.
Note: Ultima Markets is currently developing a dedicated website for UK clients and expects to onboard UK clients under FCA regulations in 2026.
If you would like to proceed and visit this website, you acknowledge and confirm the following:
- 1.The website is owned by Ultima Markets’ international entities and not by Ultima Markets UK Ltd, which is regulated by the FCA.
- 2.Ultima Markets Limited, or any of the Ultima Markets international entities, are neither based in the UK nor licensed by the FCA.
- 3.You are accessing the website at your own initiative and have not been solicited by Ultima Markets Limited in any way.
- 4.Investing through this website does not grant you the protections provided by the FCA.
- 5.Should you choose to invest through this website or with any of the international Ultima Markets entities, you will be subject to the rules and regulations of the relevant international regulatory authorities, not the FCA.
Ultima Markets wants to make it clear that we are duly licensed and authorised to offer the services and financial derivative products listed on our website. Individuals accessing this website and registering a trading account do so entirely of their own volition and without prior solicitation.
By confirming your decision to proceed with entering the website, you hereby affirm that this decision was solely initiated by you, and no solicitation has been made by any Ultima Markets entity.
I confirm my intention to proceed and enter this website

7 Steps on How to Use Fibonacci Retracement
If you’re learning how to use Fibonacci retracement, you’re already taking a smart step towards building a more structured trading strategy. This popular technical tool is trusted by traders worldwide to identify potential support and resistance zones, helping you plan better entries, exits, and stop-loss placements.
In this guide, we’ll break down how to use Fibonacci retracement in 7 easy, beginner-friendly steps. You’ll discover not only how to draw it correctly but also how to combine it with other tools to improve accuracy.
Why Fibonacci Retracement Matters in Trading
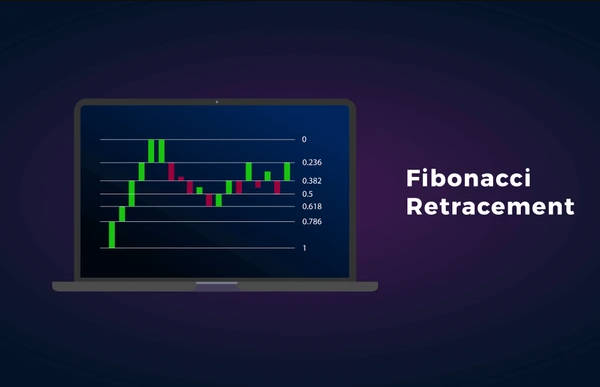
The Fibonacci retracement method is based on the famous Fibonacci sequence, a pattern of numbers with unique mathematical properties. In trading, it’s used to plot key price levels where markets might pause or reverse. Fibonacci retracement is a popular tool among traders for identifying potential support and resistance.
In trading, these ratios (especially 38.2%, 50%, and 61.8%) are used to mark price levels where the market might pause, reverse, or consolidate. These levels are drawn as horizontal lines on a chart, acting as potential support in an uptrend or resistance in a downtrend.
Key retracement levels are typically:
- 23.6%
- 38.2%
- 50%
- 61.8% (Golden ratio)
- 78.6%
The 61.8% level is based on the golden ratio, which is significant in mathematics and technical analysis.
These levels are drawn on price charts to highlight possible turning points. They are represented as horizontal lines at key Fibonacci ratios.
How Fibonacci Retracement Works
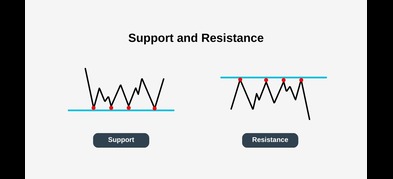
Fibonacci retracement levels are based on the Fibonacci sequence, a mathematical pattern that provides the foundation for calculating key price levels in technical analysis. Traders use Fibonacci retracement to identify areas on a chart where price may pause, reverse, or continue its trend. These retracement levels act as potential support and resistance zones, giving traders valuable insight into where the market might react.
The concept of support and resistance is central to using Fibonacci retracement. When price approaches a retracement level, traders watch closely to see if it will bounce (support) or get rejected (resistance). By analyzing these retracement levels, traders can anticipate where price might find support during a pullback or encounter resistance during a rally. This helps traders measure how much a security’s price is retracing before resuming its original trend, making Fibonacci retracement a powerful tool for identifying potential turning points in the market.
Retracement Level: What Does It Mean?
A retracement level is a specific price point where a financial instrument is expected to pull back, or retrace, a portion of its previous move before continuing in the direction of the prevailing trend. Fibonacci retracement levels are calculated by measuring the vertical distance between a high and a low point on a chart and then dividing that distance by key Fibonacci ratios—23.6%, 38.2%, 50%, 61.8%, and 100%.
These retracement levels help traders identify potential areas of support and resistance, which are crucial for making informed trading decisions. The most commonly used Fibonacci retracement levels are 38.2%, 50%, and 61.8%, as these tend to be the most significant points where price may pause or reverse. By understanding and applying these retracement levels, traders can better anticipate where price might retrace before resuming its trend, allowing for more strategic entries and exits in the market.
Drawing A Fibonacci Retracement
To draw Fibonacci retracement, traders start by identifying a swing low and a swing high in an uptrend, or a swing high and a swing low in a downtrend. There are two main methods for drawing these levels: wick-to-wick, which uses the extreme high and low points of the price (including the wicks of candlesticks), and close-to-close, which connects the closing prices of the swing points. Whichever method you choose, it’s important to be consistent to ensure reliable results.
Wick-to-Wick
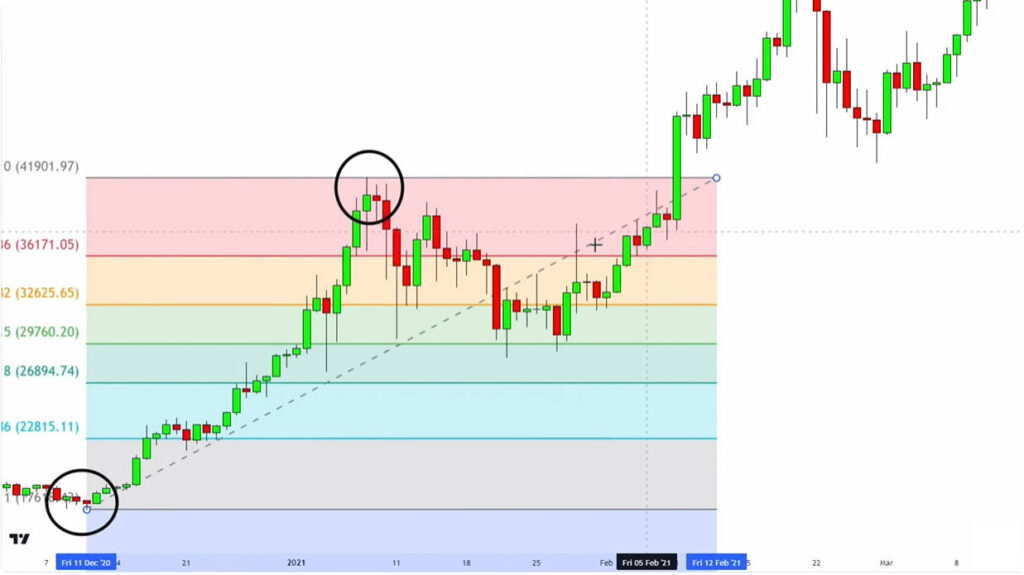
Let’s take Bitcoin (BTCUSD) on TradingView as an example. Start by identifying the swing points. We can circle up the swing low on the left, and a swing high at the right. After that, we start the Fibonacci from the lowest candlestick wick of the swing low and drag it across to the highest wick.
Close-to-Close
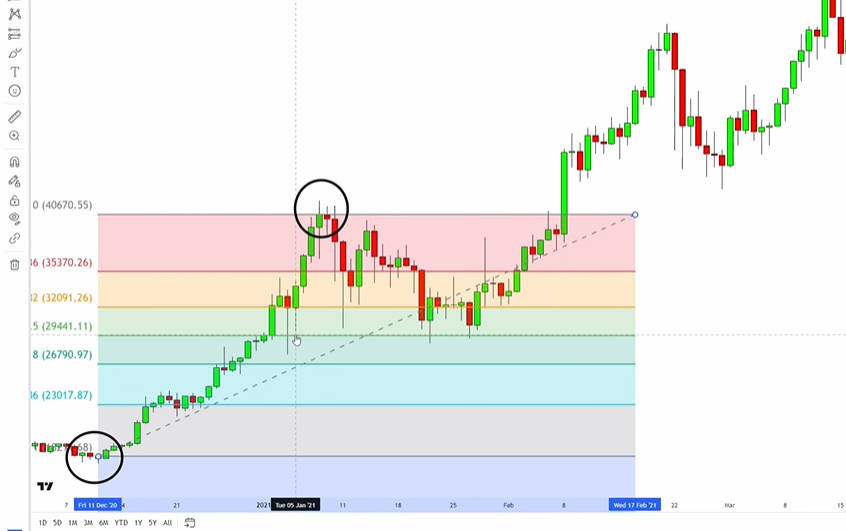
On the same chart, we’ve already identified the swing points. Select your Fibonacci point from the lowest candle close of the swing low and drag it to the highest candle close of the swing high and drag it across.
From this we can already see that the Bitcoin price initially shot up and came to a low to the Fibonacci area and proceeded to explode higher.
Mastering how to draw Fibonacci retracement levels correctly is essential for traders who want to identify potential support and resistance levels in the market. By focusing on these key points, traders can better anticipate where price might react, helping them make more informed trading decisions.
7 Easy Steps — How to Use Fibonacci Retracement
- Identify a Clear Trend
The first step in how to use Fibonacci retracement is to find a strong uptrend or downtrend. Determine the trend direction by looking for higher highs and higher lows in an uptrend, or lower highs and lower lows in a downtrend. Look for clear swing highs and swing lows. - Select the Fibonacci Retracement Tool on Your Chart Platform
Most trading platforms like MetaTrader, TradingView, and cTrader have the retracement tool built-in. - Draw from Swing High to Swing Low (or Vice Versa)
Draw the fib retracement by connecting two points: the swing high and swing low.- In an uptrend: low → high
- In a downtrend: high → low
Adjust the position of the line according to the time scale of your chart for accurate analysis.
- Watch the Key Levels
After plotting, you’ll see horizontal lines at each retracement level. These lines help identify potential entry points and stop loss levels, marking possible support or resistance zones. Popular reaction points are 38.2%, 50%, and 61.8%. - Plan Your Entry Near Key Levels
Traders often plan their trade entries at these key levels, such as the 38.2% or 61.8% retracement levels, and may set stop loss levels just beyond the next Fibonacci level. - Set Stop-Loss and Take-Profit
Stop loss levels are usually set just beyond the next Fibonacci level to manage risk and limit losses. - Confirm with Other Indicators
Combine the retracement tool with another indicator, such as RSI, moving averages, or candlestick patterns for stronger confirmation.
Using the Fibonacci retracement tool as part of your overall trading strategies can help you decide when to enter a long position after price moves to a key level.
Common Mistakes When Learning How to Use Fibonacci Retracement
| Potential Mistake | Effects |
| Choosing unclear swing points | Leads to unreliable levels |
| Using Fibonacci in isolation | Always confirm with other tools to avoid xx |
| Cluttering the chart | Too many indicators cause confusion |
Pro Tips for Mastering How to Use Fibonacci Retracement
- Practise with fibonacci retracements and fib levels on different timeframes and chart types to see how retracement behaviour changes.
- Pair with trendline analysis for extra confirmation. Experiment with different fibonacci tools to find which ones best fit your trading style.
- Use demo accounts to test your retracement strategy before risking real money.
- Keep a trading journal to record results and improve your approach.
Conclusion
Understanding how to use Fibonacci retracement can be a game-changer for traders seeking structured, disciplined decisions. Follow the 7 steps in this guide, combine them with solid risk management, and you’ll soon feel more confident in navigating market pullbacks and reversals.
Disclaimer: This content is provided for informational purposes only and does not constitute, and should not be construed as, financial, investment, or other professional advice. No statement or opinion contained here in should be considered a recommendation by Ultima Markets or the author regarding any specific investment product, strategy, or transaction. Readers are advised not to rely solely on this material when making investment decisions and should seek independent advice where appropriate.
Latest Articles

FOLLOW US


Ultima Markets is a member of The Financial Commission, an international independent body responsible for resolving disputes in the Forex and CFD markets.

All clients of Ultima Markets are protected under insurance coverage provided by Willis Towers Watson (WTW), a global insurance brokerage established in 1828, with claims eligibility up to US$1,000,000 per account.
Ultima Markets is the first CFD broker to be part of United Nations Global Compact.
FOLLOW US
TRADE WITH US
RISK DISCLOSURE
Risk Warning:
Trading leveraged financial products, including Contracts for Difference (CFDs), carries a high level of risk and may result in losses exceeding your initial investment. These products are not suitable for all investors and should only be traded with funds you can afford to lose. You do not own or have any rights to the underlying assets of these derivatives (e.g., entitlement to dividends). Please ensure you fully understand the associated risks. Before trading, consider your level of experience, investment objectives, and seek independent financial advice if necessary. Refer to our legal documents and disclosures before making any trading decisions.
General Advice Warning:
The information provided on this website is general in nature and does not take into account your personal objectives, financial situation, or needs. Before acting on any advice, you should assess its appropriateness in light of your individual circumstances and consult our legal documentation.
Regional Restrictions:
The information and services on this website are not intended for residents of certain jurisdictions, including but not limited to the United States, Singapore, and any jurisdictions subject to international sanctions. For further information, please contact our customer support team.
Regulatory Information:
-
Ultima Markets is a trading name shared amongst multiple entities operating in various jurisdictions. These following entities are authorised to operate under the Ultima Markets brand and trademarks.
-
Ultima Markets UK Limited, reference number 470325, is authorised and regulated by the Financial Conduct Authority (FCA). Registered address: One Fleet Place, London, EC4M 7WS, United Kingdom.
-
Ultima Markets Ltd is authorised and regulated by the Financial Services Commission (FSC) of Mauritius as a Full-Service Investment Dealer (excluding Underwriting), under licence number GB 23201593.
Registered address: 2nd Floor, The Catalyst, 40 Silicon Avenue, Ebene Cybercity, 72201, Mauritius.
Copyright © 2025 Ultima Markets Ltd. All rights reserved.
-

Messenger


Continue on Messenger
Take the conversation to your Messenger account. You can return anytime.
Scan the QR code and then send the message that appears in your Messenger.
Open Messenger on this device.
-

Instagram

Continue on Instagram
Take the conversation to your Instagram account. You can return anytime.
Scan the QR code to open Instagram. Follow @ultima_markets to send a DM.
Open Instagram on this device.
-

Live Chat
-
