This website is managed by Ultima Markets’ international entities, and it’s important to emphasise that they are not subject to regulation by the FCA in the UK. Therefore, you must understand that you will not have the FCA’s protection when investing through this website – for example:
You will not be guaranteed Negative Balance Protection
You will not be protected by FCA’s leverage restrictions
You will not have the right to settle disputes via the Financial Ombudsman Service (FOS)
You will not be protected by Financial Services Compensation Scheme (FSCS)
Any monies deposited will not be afforded the protection required under the FCA Client Assets Sourcebook. The level of protection for your funds will be determined by the regulations of the relevant local regulator.
Note: UK clients are kindly invited to visit https://www.ultima-markets.co.uk/. Ultima Markets UK expects to begin onboarding UK clients in accordance with FCA regulatory requirements in 2026.
If you would like to proceed and visit this website, you acknowledge and confirm the following:
1.The website is owned by Ultima Markets’ international entities and not by Ultima Markets UK Ltd, which is regulated by the FCA.
2.Ultima Markets Limited, or any of the Ultima Markets international entities, are neither based in the UK nor licensed by the FCA.
3.You are accessing the website at your own initiative and have not been solicited by Ultima Markets Limited in any way.
4.Investing through this website does not grant you the protections provided by the FCA.
5.Should you choose to invest through this website or with any of the international Ultima Markets entities, you will be subject to the rules and regulations of the relevant international regulatory authorities, not the FCA.
Ultima Markets wants to make it clear that we are duly licensed and authorised to offer the services and financial derivative products listed on our website. Individuals accessing this website and registering a trading account do so entirely of their own volition and without prior solicitation.
By confirming your decision to proceed with entering the website, you hereby affirm that this decision was solely initiated by you, and no solicitation has been made by any Ultima Markets entity.
What does YTD mean? Learn how Year to Date is used in finance, paystubs, and trading. Includes examples, formulas, and expert analysis.
What Does YTD Mean in Finance?
In finance, YTD (Year to Date) refers to the cumulative total of an account or metric such as revenue, expenses, net income, or stock returns from the beginning of the year to the current date.
For example:
In trading, YTD helps track how much a stock, ETF, or portfolio has gained or lost so far this year.
In corporate finance, companies use YTD data to compare performance across quarters and forecast future outcomes.
For employees, YTD on a paystub shows total earnings, deductions, and taxes paid since January 1.
Key Uses:
Performance comparison
Earnings tracking
Tax estimation
Budgeting and forecasting
What Does YTD Mean on Paystubs and Paychecks?
YTD on a paystub stands for “Year to Date” and shows the total amount you’ve earned or paid in taxes from the beginning of the year to the current pay period. It typically includes gross pay, net pay, and tax withholdings. For example, if you earn $5,000/month, after 6 months your gross YTD would be $30,000.
Fiscal Year vs Calendar Year: Which One Does YTD Follow?
Understanding the difference between a fiscal year and calendar year is essential when interpreting YTD figures:
Type
Starts
Ends
Example
Calendar Year
January 1
December 31
Most personal finance tools
Fiscal Year
Varies by organization
12 months later
Oct 1, 2024 – Sep 30, 2025 (U.S. Federal Government)
How to Calculate YTD (Year to Date)
To calculate YTD:
Identify the start date (usually January 1 or start of fiscal year)
Sum the total values (income, returns, expenses) from that date to today
YTD Formula
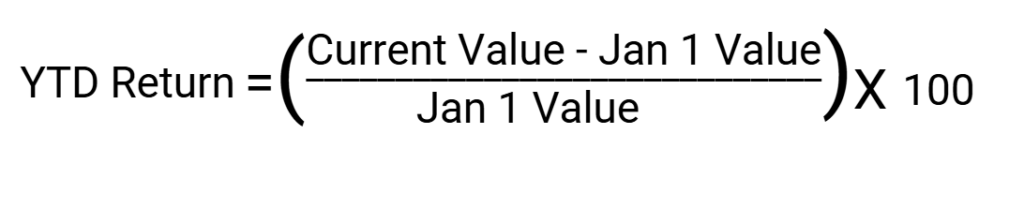
To calculate YTD return, subtract the value of the investment on January 1 from its current value. Then divide the result by the January 1 value. Finally, multiply by 100 to get the percentage.
Step-by-step:
Subtract: Current Value – Value on January 1
Divide: Result ÷ Value on January 1
Multiply: That number × 100 = YTD return %
Example: If a stock was $100 on Jan 1 and is now $125: (125 − 100) ÷ 100 × 100 = 25% YTD return
Real World Example: Trader Analysis
Let’s say Tesla (TSLA) started the year at $240, and the current price is $280. Here’s how to calculate the YTD return step by step:
Find the change in price: $280 (current price) – $240 (price on Jan 1) = $40 gain
Divide the gain by the starting value: $40 ÷ $240 = 0.1667
Convert to a percentage: 0.1667 × 100 = 16.67%
So, the YTD return for Tesla is 16.67%.
A trader uses this YTD return to:
Compare TSLA’s performance with S&P 500 or sector peers
Adjust portfolio allocation based on outperformance or underperformance
Make data-driven trade entries based on momentum
YTD helps provide context, not just for individual stocks, but for entire portfolios and index performance.
Month to Date vs Year to Date
Month to Date (MTD) and Year to Date (YTD) serve similar functions but differ in scope:
Metric
Timeframe
Use
YTD
Jan 1 (or fiscal start) to today
Long-term performance
MTD
1st of current month to today
Short-term tracking
Why YTD Matters for Traders and Investors
YTD (Year to Date) data is a powerful metric for traders and investors to measure performance, spot trends, and manage risk across portfolios. It provides a real-time snapshot of how a stock, index, or asset class has performed since the beginning of the year.
Key Reasons YTD Is Important:
Performance Benchmarking Traders use YTD returns to compare individual stocks or ETFs against market indices like the S&P 500, NASDAQ, or sector averages.
Risk Management A sharp YTD loss may signal elevated volatility or trend reversal, prompting portfolio adjustments or tighter stop-loss strategies.
Momentum Analysis Positive YTD performance often reflects strong momentum or investor sentiment, helping traders identify trending assets for swing or position trades.
Rebalancing Decisions Investors use YTD data to assess overperformers and underperformers before reallocating capital or rebalancing portfolios.
Macro Insights In global markets, YTD metrics help traders spot rotation between sectors, regions, or asset classes valuable in a volatile macro environment.
Example: If tech stocks show strong YTD returns while energy lags, it may indicate a risk-on market environment favoring growth over value.
Conclusion
Understanding what YTD means in finance isn’t just for accountants, it’s a key tool for traders and investors looking to stay ahead in fast-moving markets. Whether you’re analyzing your paycheck, evaluating stock performance, or comparing YTD returns across sectors, this metric provides critical insights for smarter financial decisions.
At Ultima Markets, we equip traders with real-time YTD data, advanced charting tools, and macroeconomic insights, so you can make better-informed trades backed by data, not guesses. Track your performance. Measure your edge. Trade with confidence.
Share Now
Disclaimer:This content is provided for informational purposes only and does not constitute, and should not be construed as, financial, investment, or other professional advice. No statement or opinion contained herein should be considered a recommendation by Ultima Markets or the author regarding any specific investment product, strategy, or transaction. Readers are advised not to rely solely on this material when making investment decisions and should seek independent advice where appropriate.
Thank you for visiting the Ultima Markets website. Please note that this website is intended for individuals residing in jurisdictions where access is permitted by law. Ultima and its affiliated entities do not operate in your home jurisdiction.
By clicking ‘Acknowledge’, you confirm that you are entering this website solely on your own initiative and not as a result of any specific marketing outreach. You wish to obtain information from this website based on reverse solicitation principles, in accordance with the applicable laws of your home jurisdiction.