Ultima Markets App
Trade Anytime, Anywhere
Important Information
This website is managed by Ultima Markets’ international entities, and it’s important to emphasise that they are not subject to regulation by the FCA in the UK. Therefore, you must understand that you will not have the FCA’s protection when investing through this website – for example:
- You will not be guaranteed Negative Balance Protection
- You will not be protected by FCA’s leverage restrictions
- You will not have the right to settle disputes via the Financial Ombudsman Service (FOS)
- You will not be protected by Financial Services Compensation Scheme (FSCS)
- Any monies deposited will not be afforded the protection required under the FCA Client Assets Sourcebook. The level of protection for your funds will be determined by the regulations of the relevant local regulator.
Note: Ultima Markets is currently developing a dedicated website for UK clients and expects to onboard UK clients under FCA regulations in 2026.
If you would like to proceed and visit this website, you acknowledge and confirm the following:
- 1.The website is owned by Ultima Markets’ international entities and not by Ultima Markets UK Ltd, which is regulated by the FCA.
- 2.Ultima Markets Limited, or any of the Ultima Markets international entities, are neither based in the UK nor licensed by the FCA.
- 3.You are accessing the website at your own initiative and have not been solicited by Ultima Markets Limited in any way.
- 4.Investing through this website does not grant you the protections provided by the FCA.
- 5.Should you choose to invest through this website or with any of the international Ultima Markets entities, you will be subject to the rules and regulations of the relevant international regulatory authorities, not the FCA.
Ultima Markets wants to make it clear that we are duly licensed and authorised to offer the services and financial derivative products listed on our website. Individuals accessing this website and registering a trading account do so entirely of their own volition and without prior solicitation.
By confirming your decision to proceed with entering the website, you hereby affirm that this decision was solely initiated by you, and no solicitation has been made by any Ultima Markets entity.
I confirm my intention to proceed and enter this website Please direct me to the website operated by Ultima Markets , regulated by the FCA in the United KingdomStrategies on How to Exchange CAD to TWD
As Taiwanese investors increasingly expand their global asset allocation, CAD to TWD has become a trending topic. As a major resource-exporting country, Canada’s currency fluctuations directly impact investor returns and risk management.
What is CAD to TWD and Why Does It Matter?
CAD to TWD refers to the exchange of Canadian Dollars (CAD) into New Taiwan Dollars (TWD). Given Canada’s close ties to global commodity prices, CAD movements often reflect broader international economic trends and significantly influence investment decisions.
In 2024, the Bank of Canada implemented multiple rate hikes, resulting in a 7% annual fluctuation in CAD. This has prompted investors to closely monitor exchange timing to minimize currency conversion losses.

What Drives the CAD to TWD Exchange Rate?
The CAD to TWD rate is mainly influenced by the Bank of Canada’s monetary policies, oil price fluctuations, U.S. economic data, and global trade conditions.
In 2023, the Bank of Canada raised interest rates to 5.0%, pushing CAD to TWD up by approximately 5.3% over the year. Additionally, for every 1% increase in Canada’s GDP, the Canadian dollar tends to show a notable appreciation.
How Do Oil Prices Impact the Canadian Dollar?
As a major oil exporter, Canada sees its currency strengthen when oil prices rise. Between 2022 and 2024, crude oil climbed from USD 60 to USD 85 per barrel, while CAD to TWD rose from 21.0 to 24.5 accordingly.

How Does the U.S. Economy Affect the CAD?
Canada’s economy is deeply intertwined with that of the United States. In 2024, the U.S. recorded a 2.7% GDP growth, during which CAD to TWD appreciated by 3.2%, underscoring the high correlation between the two economies.
Historical Trends and Future Outlook for CAD to TWD
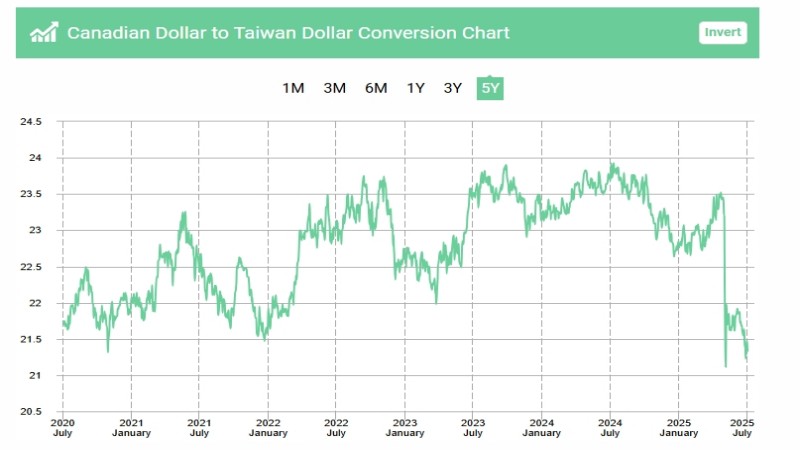
When analyzing CAD to TWD exchange trends, historical data provides valuable context. Below is a summary of the average annual exchange rate for the past five years, based on data from the Bank of Canada and Bank of Taiwan:
| Year | Average Rate (1 CAD = TWD) | High-Low Range | Annual Trend |
| 2020 | 21.37 | 20.45 – 22.10 | Slight appreciation |
| 2021 | 22.29 | 21.68 – 23.11 | Accelerated gain |
| 2022 | 23.08 | 22.00 – 24.35 | Continued rise |
| 2023 | 22.46 | 21.50 – 24.15 | Pullback & consolidation |
| 2024 | 23.12 (as of June) | 22.10 – 24.30 | Moderate recovery |
Overall, CAD to TWD has fluctuated within a ~20% range over the past five years, alternating between sideways consolidation and structural appreciation.
Looking ahead, the Bank of Canada projects its policy rate will likely remain above 4.75% through 2025. Combined with steady global demand for raw materials, this provides medium- to long-term support for the CAD. At the same time, an expected rate-cut cycle from the U.S. Federal Reserve could weaken the U.S. dollar, creating additional upside for CAD to TWD.
However, in the short term, a strong rebound in the U.S. economy may put pressure on the Canadian dollar. Investors should closely monitor Canada’s employment figures, GDP growth, and crude oil prices, and adjust their CAD to TWD strategies accordingly.

Tips and Strategies for Exchanging CAD to TWD
Improving results in CAD to TWD exchange involves more than just comparing rates. The key lies in choosing the right timing, minimizing costs, and using strategic tools. Here are some expert tips:
Use Dollar-Cost Averaging to Reduce Risk
Splitting the exchange into multiple phases helps mitigate market volatility. For example, dividing the total amount into three parts and using technical indicators such as KDJ, RSI, or Bollinger Bands can help avoid converting at peaks or bottoms.
Leverage Real-Time Quotes and Charts
Exchange rates fluctuate by the minute, so access to real-time information is crucial. Ultima Markets offers high-frequency CAD to TWD charts with overlaid technical indicators, historical price ranges, and volume data, ideal for identifying support and resistance zones.
Compare Total Costs: Banks vs. Forex Platforms
Take a TWD 100,000 to CAD exchange as an example:
- Traditional banks may charge a 0.3% handling fee plus a 0.6% spread, totaling a cost of TWD 900.
- On Ultima Markets, the spread can be as low as 0.15% with zero additional fees—saving up to TWD 750, which is a significant advantage for frequent exchangers.
Practice Entry and Exit with a Demo Account
Beginners can use a demo account to observe their own trading rhythm—for example, shorting during CAD strength or going long during weakness. This helps build directional judgment for currency movements. Once familiar, transitioning to a trading account can significantly boost both confidence and profitability.
Advanced Users: Combine Leverage and Stop-Loss for Short-Term Arbitrage
By using 2x leverage in short-term CAD/TWD trading, and setting a 2% trailing take-profit with a 1% stop-loss, traders can capture small spreads during price fluctuations. Ultima Markets offers flexible leverage and risk-control parameters, making it ideal for advanced users to implement dynamic strategies.
When paired with a low-spread, zero-fee, real-time data platform like Ultima Markets, these strategies make CAD to TWD exchanges more efficient and cost-effective. This lowers the entry barrier and empowers Taiwanese investors to participate more actively in the global market.
Investment Risks of CAD to TWD and How to Manage Them
Foreign exchange investments carry inherent currency fluctuation risks. Effective risk management is essential. Practical control measures include:
- Set stop-loss levels to prevent losses exceeding 3% of principal per trade.
- Use leverage conservatively; beginners are advised to stay within 5x.
- Break exchanges into phases to smooth out market volatility.
According to the Bank of Canada, the CAD experienced a monthly volatility high of 1.5% in 2023. Investors should remain cautious to avoid excessive losses from unexpected swings.
Real-World Case Studies: CAD to TWD in Action
Let’s look at two real-life CAD to TWD examples to better understand how exchange rate changes translate into financial impact:
Case 1: Timely Entry Captures an Upswing
In March 2023, Ms. Chang exchanged TWD 300,000 at a rate of 21.10, receiving approximately 14,218 CAD. After testing strategies using Ultima Markets’ demo account, she monitored oil prices and interest rates, then exchanged back in August when the rate reached 23.85, returning TWD 339,840. Her gain from the exchange difference was 13.3%.
Case 2: Missed Timing Leads to Opportunity Cost
That same year, Mr. Wang bought CAD at a peak rate of 24.10 in May but failed to exchange back promptly. By October, the rate had dropped to 22.30. Had he converted back then, he would have lost over TWD 18,000. This case highlights the importance of using real-time charts and technical analysis to determine optimal exit timing.
These examples show that CAD to TWD success hinges not only on using low-cost platforms, but also on combining data tools and planned entry/exit strategies to maximize the benefits of forex asset allocation.

Frequently Asked Questions
Q: Are there hidden fees when exchanging CAD to TWD?
A: The main costs come from spreads and handling fees charged by banks or trading platforms. It’s important to compare them carefully.
Q: Where can I check accurate CAD trends?
A: Professional platforms such as Ultima Markets offer real-time charts that provide more precise insight into market movements.
Q: Are Canadian fixed deposits worth investing in?
A: Currently, Canada’s one-year fixed deposit rates are generally over 4%, making them more attractive than Taiwan’s interest rates.
Conclusion
Mastering the knowledge and strategies for CAD to TWD can significantly enhance investment performance. Taiwanese investors are encouraged to utilize low-cost, real-time data platforms like Ultima Markets to practice exchange strategies through a demo account, and actively participating in the forex market via a trading account. This approach supports secure and effective asset growth, helping investors take full advantage of CAD to TWD opportunities.
Disclaimer: This content is provided for informational purposes only and does not constitute, and should not be construed as, financial, investment, or other professional advice. No statement or opinion contained here in should be considered a recommendation by Ultima Markets or the author regarding any specific investment product, strategy, or transaction. Readers are advised not to rely solely on this material when making investment decisions and should seek independent advice where appropriate.


