This website is managed by Ultima Markets’ international entities, and it’s important to emphasise that they are not subject to regulation by the FCA in the UK. Therefore, you must understand that you will not have the FCA’s protection when investing through this website – for example:
You will not be guaranteed Negative Balance Protection
You will not be protected by FCA’s leverage restrictions
You will not have the right to settle disputes via the Financial Ombudsman Service (FOS)
You will not be protected by Financial Services Compensation Scheme (FSCS)
Any monies deposited will not be afforded the protection required under the FCA Client Assets Sourcebook. The level of protection for your funds will be determined by the regulations of the relevant local regulator.
Note: UK clients are kindly invited to visit https://www.ultima-markets.co.uk/. Ultima Markets UK expects to begin onboarding UK clients in accordance with FCA regulatory requirements in 2026.
If you would like to proceed and visit this website, you acknowledge and confirm the following:
1.The website is owned by Ultima Markets’ international entities and not by Ultima Markets UK Ltd, which is regulated by the FCA.
2.Ultima Markets Limited, or any of the Ultima Markets international entities, are neither based in the UK nor licensed by the FCA.
3.You are accessing the website at your own initiative and have not been solicited by Ultima Markets Limited in any way.
4.Investing through this website does not grant you the protections provided by the FCA.
5.Should you choose to invest through this website or with any of the international Ultima Markets entities, you will be subject to the rules and regulations of the relevant international regulatory authorities, not the FCA.
Ultima Markets wants to make it clear that we are duly licensed and authorised to offer the services and financial derivative products listed on our website. Individuals accessing this website and registering a trading account do so entirely of their own volition and without prior solicitation.
By confirming your decision to proceed with entering the website, you hereby affirm that this decision was solely initiated by you, and no solicitation has been made by any Ultima Markets entity.
Johnson & Johnson’s stock is a key indicator in healthcare investment. Both 4747 and JNJ trends influence market capital allocation and strategy adjustments.
2025 Johnson & Johnson Stock Trends and Buy Guide
Johnson & Johnson’s stock is a crucial indicator for investors tracking the global healthcare industry. Whether it’s JNJ in the US market or 4747 in Taiwan, both reflect the overall direction of the medical sector. Post-pandemic, healthcare stocks have become increasingly popular among Taiwanese investors, making Johnson & Johnson’s stock highly watched.
Why do investors pay close attention to Johnson & Johnson’s stock? On one hand, its price movements directly mirror the state of the healthcare industry; on the other, stock analysis helps investors forecast future investment trends in the medical market.
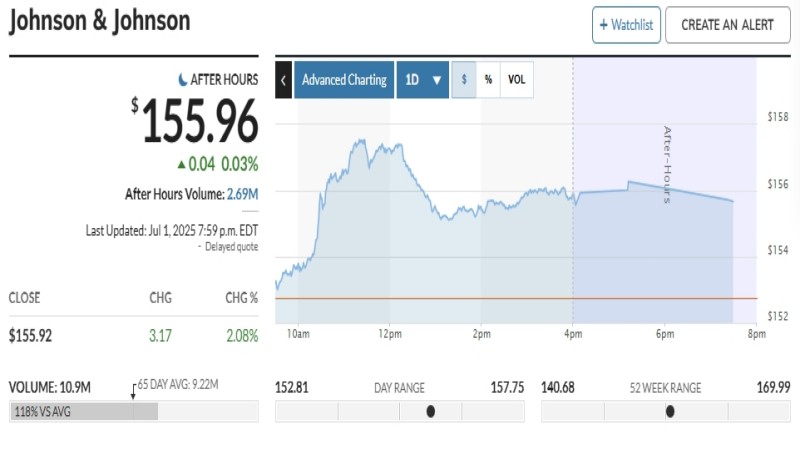
For instance, JNJ in the US has fluctuated between $150 and $180 over the past three years, drawing interest from many Taiwanese investors. Meanwhile, Taiwan’s Johnson & Johnson (4747) has risen more than 10% in the past year, with a stable dividend yield around 4%, performing steadily and exceeding market expectations.
In this article, we will explore the key factors influencing Johnson & Johnson’s stock price, methods for analyzing its trends, and practical investment strategies to enhance potential returns.
What Is Johnson & Johnson? Understanding the Two Major “Johnsons”
When Taiwanese investors talk about “Johnson’s stock price,” they are actually referring to two different companies: Taiwan’s Johnson Health Tech Co., Ltd. (4747.TWO) and the US-based Johnson & Johnson (NYSE: JNJ). Despite sharing the same name, they belong to different markets, operate in distinct business areas, and follow different growth models.
Taiwan’s Johnson focuses on dental equipment, medical consumables, and aesthetic medical devices. It has stable B2B order sources and established medical distribution channels, with steady revenue and transparent dividend policies.
Johnson & Johnson in the US, on the other hand, is one of the world’s largest medical product manufacturers. Its business spans pharmaceuticals, medical devices, and consumer healthcare products. Its stock price is often influenced by global healthcare reforms, litigation cases, and major mergers or acquisitions.
4747.TWO Taiwan Johnson Investment Characteristics
In recent years, Taiwan Johnson’s stock price has remained within the NT$40 to NT$55 range, classifying it as a mid- to low-priced stock. According to financial reports, as of Q1 2025, its earnings per share (EPS) reached NT$3.07, with an annualized price-to-earnings (P/E) ratio of about 13 times and a dividend yield between 4% and 5%. This makes it attractive to investors seeking stable cash dividends.
Beyond its steady cash flow, 4747 also shows technical strengths. Its 20-day moving average has repeatedly provided strong support, while the monthly and quarterly moving averages have formed a golden cross pattern, indicating a positive medium-term trend. Combined with MACD and KDJ technical indicators, buy signals appear relatively clear, making it suitable for medium- to long-term investors.
International Indicators of US JNJ Stock Prices
In comparison, JNJ (Johnson & Johnson US stock) holds strong international representation, with a market capitalization exceeding USD 400 billion and being a component of the Dow Jones Industrial Average. According to its May 2025 financial report, JNJ recorded a 6.2% year-on-year revenue growth and maintained a net profit margin above 20%, ensuring high-quality returns on assets and stable dividend payouts.
JNJ has long been included in major ETFs such as VHT and XLV, classifying it as a defensive, long-term, anti-cyclical asset. Over the past five years, its stock price has steadily risen from USD 118 to the USD 180 range, delivering considerable cumulative returns. Particularly during market turbulence, such large-cap healthcare stocks often serve as valuable hedging assets.
Three Key Factors to Watch When Investing in Johnson & Johnson Stocks
First, Financial Report Stability. Whether it’s 4747 or JNJ, regularly reviewing revenue structure and EPS trends provides essential fundamental analysis.
Second, Dividend Policy. 4747 has consistently issued cash dividends over the past three years, while JNJ, a classic dividend aristocrat, has maintained uninterrupted dividend payouts for 61 consecutive years, making it highly attractive to cash flow-focused investors.
Third, Stock Price Volatility and Technical Patterns. 4747, due to its smaller market scale, experiences relatively higher price fluctuations, whereas JNJ is influenced by market events and international policies. Technical analysis should be combined with news and industry reports for better judgment.
Johnson & Johnson Stock Analysis: The Importance of Combining Technical and Fundamental Indicators
When evaluating Johnson & Johnson’s stock, relying solely on price trends is often insufficient for making effective investment decisions. Investors need to integrate technical analysis with fundamental assessments to better align with market dynamics. Particularly for 4747 and JNJ, which belong to the healthcare sector and are characterized by high defensiveness and stable cash flow, their stock price fluctuation patterns differ significantly from those of growth or tech stocks.
Technical Indicators: Practical Application of KDJ and Moving Average Crossovers
Taking 4747 as an example, investors can use the crossover of the 20-day and 60-day moving averages to identify short- to medium-term trend reversals. Additionally, when the KDJ indicator forms a golden cross at a low level accompanied by increasing trading volume, it often signals a short-term rebound opportunity. For instance, in Q4 2024, 4747 rebounded from NT$45, with clear technical buy signals, achieving a 12% gain in just one month.
For JNJ, RSI and MACD are commonly used to monitor trends. During periods when the broader US stock market shows steady strength, JNJ often demonstrates relatively defensive performance, attracting long-term investors to seek buying opportunities during market downturns.
Fundamental Factors: The Core Role of Revenue Stability and Dividend Policy
For 4747, Q1 2025 revenue grew 7.5% year-on-year, marking a five-quarter high. Its main growth drivers came from medical aesthetic consumables and distribution channel expansion. Gross margin has consistently stayed above 55%, reflecting solid pricing power. Over the past three years, its average cash dividend was NT$2.5 per share, with a payout ratio of 80%, making it highly appealing to income-focused investors.
As for JNJ, core drugs such as Stelara and Darzalex remain its primary revenue contributors, with total revenue reaching USD 96.8 billion in 2024. Its R&D spending ratio has remained above 15%, underscoring strong long-term growth potential.
The Importance of Choosing the Right Trading Platform: Why Do Investors Prefer UM?
As global investing becomes increasingly accessible, choosing the right trading platform is crucial. Ultima Markets (UM) offers highly flexible trading conditions for Taiwanese investors, including a minimum trade size of 0.01 lots, transparent pricing, STP straight-through processing execution, and 24-hour customer support making it a reliable choice for both beginners and experienced investors.
UM supports CFD products for US stocks such as JNJ, providing flexible leverage, minimal trade size, and low spreads. With a traditional Chinese interface and professional customer service, Taiwanese users can seamlessly adapt to the trading environment.
More importantly, UM provides comprehensive educational and strategy resources, including technical indicator tutorials, data research reports, and real-time market analysis, helping users improve decision-making skills. For those who want to experience it firsthand, registering a trading account allows you to start cross-market investing immediately.
Understanding Global Healthcare Investment Through Johnson & Johnson’s Stock
Whether investing in Taiwan’s 4747.TWO or participating in the global healthcare landscape via JNJ, Johnson & Johnson’s stock remains a key indicator of shifts in the healthcare industry. With global population aging, heightened post-pandemic health awareness, and surging investments in pharmaceuticals and medical technology R&D, the healthcare sector is steadily moving toward long-term growth.
Both 4747 and JNJ play distinct roles in this trend. 4747 focuses on stable cash flow and local market advantages, making it suitable for medium- to high-dividend strategies, while JNJ emphasizes global expansion and steady asset appreciation, ideal for long-term compounding growth.
For Taiwanese investors, the key is not simply choosing between the two, but selecting the right platform and risk management strategies to make Johnson & Johnson’s stock a stable component of their investment portfolio.
FAQ
Q1: How to Choose Between 4747 and JNJ?
Taiwanese investors can decide based on risk tolerance and capital allocation. Risk-averse investors may opt for 4747 for stable dividends and relatively low volatility. Those with experience in US stock trading and long-term allocation goals may consider JNJ, which offers historical returns and a strong global healthcare presence.
Q2: Should You Increase Positions When Johnson & Johnson’s Stock Drops?
First, determine whether the decline is due to weakened fundamentals or short-term market sentiment. If it’s the latter, using technical support levels such as the lower Bollinger Band or oversold KD indicators can signal potential long-term buying opportunities.
Q3: Is It Suitable to Use Leverage to Invest in Johnson & Johnson’s Stock?
Leverage should be used cautiously, considering volatility and trading habits. JNJ has relatively low volatility, making short-term leveraged gains limited, while 4747 has lower liquidity, requiring stricter risk control when trading CFDs. Beginners are advised to practice with a demo account first to familiarize themselves with order placement and risk management.
Q4: Where Can You Trade Johnson & Johnson-Related Assets?
Taiwanese investors can trade 4747 through local brokers, while JNJ requires opening an account with an overseas broker or using a CFD platform like Ultima Markets, which allows participation with smaller capital, leverage trading, and risk management tools such as stop-loss and take-profit orders.
Conclusion: Navigate Your Own Path with Strategy and Discipline in Johnson & Johnson’s Stock
Johnson & Johnson’s stock is more than just price fluctuations, it reflects the interaction between industries and economic environments. For Taiwanese investors, understanding its fundamentals and movement logic helps build a cross-market perspective and sound risk management habits.
Investing is never about blind following or guessing; it is about interpreting information and practicing discipline. From demo trading to real market entry, from basic technical analysis to in-depth fundamental evaluation, UM provides the tools and environment that allow every investor to find their rhythm and direction amid Johnson & Johnson’s stock movements.
Whether you seek stable cash flow or global allocation opportunities, Johnson & Johnson’s stock is a key milestone you should not overlook.
Share Now
Disclaimer:This content is provided for informational purposes only and does not constitute, and should not be construed as, financial, investment, or other professional advice. No statement or opinion contained herein should be considered a recommendation by Ultima Markets or the author regarding any specific investment product, strategy, or transaction. Readers are advised not to rely solely on this material when making investment decisions and should seek independent advice where appropriate.
Thank you for visiting the Ultima Markets website. Please note that this website is intended for individuals residing in jurisdictions where access is permitted by law. Ultima and its affiliated entities do not operate in your home jurisdiction.
By clicking ‘Acknowledge’, you confirm that you are entering this website solely on your own initiative and not as a result of any specific marketing outreach. You wish to obtain information from this website based on reverse solicitation principles, in accordance with the applicable laws of your home jurisdiction.