This website is managed by Ultima Markets’ international entities, and it’s important to emphasise that they are not subject to regulation by the FCA in the UK. Therefore, you must understand that you will not have the FCA’s protection when investing through this website – for example:
You will not be guaranteed Negative Balance Protection
You will not be protected by FCA’s leverage restrictions
You will not have the right to settle disputes via the Financial Ombudsman Service (FOS)
You will not be protected by Financial Services Compensation Scheme (FSCS)
Any monies deposited will not be afforded the protection required under the FCA Client Assets Sourcebook. The level of protection for your funds will be determined by the regulations of the relevant local regulator.
Note: UK clients are kindly invited to visit https://www.ultima-markets.co.uk/. Ultima Markets UK expects to begin onboarding UK clients in accordance with FCA regulatory requirements in 2026.
If you would like to proceed and visit this website, you acknowledge and confirm the following:
1.The website is owned by Ultima Markets’ international entities and not by Ultima Markets UK Ltd, which is regulated by the FCA.
2.Ultima Markets Limited, or any of the Ultima Markets international entities, are neither based in the UK nor licensed by the FCA.
3.You are accessing the website at your own initiative and have not been solicited by Ultima Markets Limited in any way.
4.Investing through this website does not grant you the protections provided by the FCA.
5.Should you choose to invest through this website or with any of the international Ultima Markets entities, you will be subject to the rules and regulations of the relevant international regulatory authorities, not the FCA.
Ultima Markets wants to make it clear that we are duly licensed and authorised to offer the services and financial derivative products listed on our website. Individuals accessing this website and registering a trading account do so entirely of their own volition and without prior solicitation.
By confirming your decision to proceed with entering the website, you hereby affirm that this decision was solely initiated by you, and no solicitation has been made by any Ultima Markets entity.
A shooting star signals a bearish reversal after an uptrend. Learn how to identify, confirm, and trade this candlestick for better decisions.
What Is a Shooting Star Candlestick and How Do You Trade It?
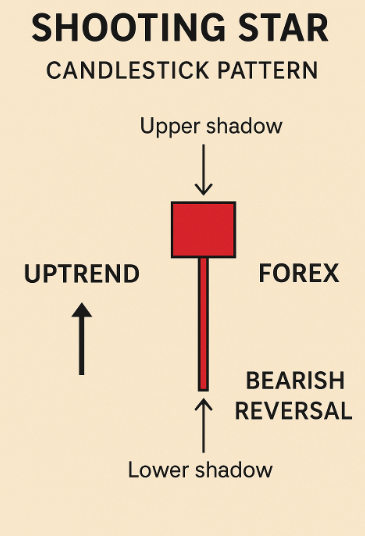
The shooting star candlestick pattern is a bearish reversal pattern that appears at the top of an uptrend. It signals a potential trend reversal, suggesting that the price of an asset may start to decline. This pattern can provide traders with early indications of a shift in market sentiment.
What Are the Characteristics of a Shooting Star Candlestick?
A shooting star candlestick has a few key characteristics that make it recognisable:
Small Body: The real body of the candlestick, representing the open and close prices, is relatively small.
Long Upper Shadow: The upper shadow, extending above the real body, is long, at least twice the length of the body. This long shadow represents the price’s attempt to move higher, which was ultimately rejected by the market.
Short or Non-Existent Lower Shadow: The lower shadow, if present, is very short or non-existent. This indicates that there wasn’t much selling pressure during the period.
Appearance at the Top of an Uptrend: The shooting star appears after a price has generally been rising, signalling potential exhaustion of the upward momentum.
Visually, it resembles a shooting star falling from the sky, hence the name. Its distinct shape sets it apart from other candlestick patterns.
What Does the Shooting Star Candlestick Pattern Indicate?
The shooting star candlestick pattern indicates a potential reversal from an uptrend to a downtrend. It suggests that the bulls, who were previously in control, are losing their grip, and the bears are starting to take over.
Traders often interpret the shooting star as a warning sign. It doesn’t guarantee a reversal, but it suggests an increased probability of one. Confirmation is frequently sought through subsequent price action.
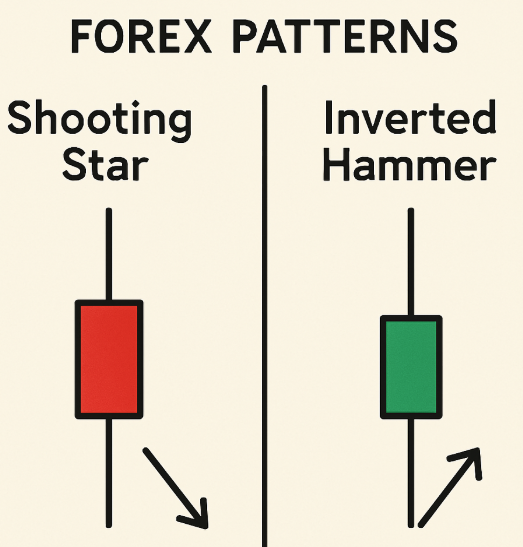
Differences Between Shooting Star and Inverted Hammer
At first glance, the shooting star candlestick and the inverted hammer candlestick share similar visual traits, but they convey different market implications. Here’s how they differ:
Feature
Shooting Star
Inverted Hammer
Trend Context
Appears after an uptrend
Forms after a downtrend
Market Signal
Bearish reversal signal
Bullish reversal signal
Upper Wick
Long upper wick
Long upper wick
Lower Wick
Little to none
Little to none
Real Body
Small, at the lower end of the range
Small, at the lower end of the range
The primary distinction lies in their placement within a trend. While the shooting star suggests a potential bearish reversal in an uptrend, the inverted hammer signals a possible bullish reversal after a downtrend. Traders use the shooting star to anticipate selling opportunities, whereas the inverted hammer is associated with buying opportunities.
Advantages of Using the Shooting Star Candlestick Pattern
Using the shooting star candlestick pattern offers several advantages:
Early Warning Signal: It can provide an early indication of a potential trend reversal, allowing traders to prepare for potential price declines.
Easy to Identify: The pattern’s distinct shape makes it relatively easy to identify on a price chart.
Can be Used in Conjunction with Other Indicators: Traders can combine the shooting star with other technical indicators, such as volume or moving averages, to increase the reliability of the signal.
Helps in Setting Stop-Loss Orders: The pattern can assist traders in setting appropriate stop-loss levels to manage risk.
Disadvantages of Using the Shooting Star Candlestick Pattern
Despite its advantages, the shooting star pattern also has some limitations:
Not a Foolproof Indicator: Like any technical indicator, the shooting star is not always accurate. False signals can occur, leading to losses.
Requires confirmation: Look for confirmation of the reversal through subsequent price action. A single shooting star isn’t enough to make a trade.
Subjectivity in Identification: While the general characteristics are clear, some subjectivity can be involved in identifying a ‘true’ shooting star. Traders may have slightly different interpretations.
Works Best in Specific Market Conditions: The shooting star pattern is most effective in trending markets. In choppy or sideways markets, its reliability can be diminished.
Shooting Star Trading Strategy
Several trading strategies can be employed when using the shooting star candlestick pattern:
Confirmation Is Key: Don’t immediately enter a trade based on the shooting star alone. Wait for confirmation, such as a bearish candlestick in the following period or a break below a support level. Increased volume on the confirming candle adds weight to the signal.
Combine with Other Indicators: Use the shooting star in conjunction with other technical indicators, like the Relative Strength Index (RSI) or moving averages, to filter out false signals and improve the accuracy of your trades. For instance, if the RSI is also overbought when a shooting star appears, it strengthens the bearish signal.
Set Appropriate Stop-Loss Orders: Place a stop-loss order above the high of the shooting star to limit potential losses if the price continues to rise. This helps manage risk effectively.
Target Potential Support Levels: Identify potential support levels where the price might find buyers. These levels can serve as price targets for your trades.
Consider the Overall Trend: The shooting star is most effective when it appears at the top of a well-defined uptrend. Be cautious about using it in other market conditions.
Practice and Experience: The best way to master trading with the shooting star pattern is through practice and experience. Use a demo account to test different strategies before risking real capital.
Conclusion
The Shooting Star candlestick is a reliable signal for spotting potential bearish reversals at the top of an uptrend. When confirmed by strong resistance zones, high volume, or bearish indicators like RSI divergence, this pattern can offer high-probability trade setups.
To maximize your edge, always combine candlestick patterns with sound risk management and market context.
Start applying these strategies with a trusted broker like Ultima Markets, where you gain access to advanced charting tools, real-time data, and institutional-grade execution.
Share Now
Disclaimer:This content is provided for informational purposes only and does not constitute, and should not be construed as, financial, investment, or other professional advice. No statement or opinion contained herein should be considered a recommendation by Ultima Markets or the author regarding any specific investment product, strategy, or transaction. Readers are advised not to rely solely on this material when making investment decisions and should seek independent advice where appropriate.
Thank you for visiting the Ultima Markets website. Please note that this website is intended for individuals residing in jurisdictions where access is permitted by law. Ultima and its affiliated entities do not operate in your home jurisdiction.
By clicking ‘Acknowledge’, you confirm that you are entering this website solely on your own initiative and not as a result of any specific marketing outreach. You wish to obtain information from this website based on reverse solicitation principles, in accordance with the applicable laws of your home jurisdiction.