This website is managed by Ultima Markets’ international entities, and it’s important to emphasise that they are not subject to regulation by the FCA in the UK. Therefore, you must understand that you will not have the FCA’s protection when investing through this website – for example:
You will not be guaranteed Negative Balance Protection
You will not be protected by FCA’s leverage restrictions
You will not have the right to settle disputes via the Financial Ombudsman Service (FOS)
You will not be protected by Financial Services Compensation Scheme (FSCS)
Any monies deposited will not be afforded the protection required under the FCA Client Assets Sourcebook. The level of protection for your funds will be determined by the regulations of the relevant local regulator.
Note: UK clients are kindly invited to visit https://www.ultima-markets.co.uk/. Ultima Markets UK expects to begin onboarding UK clients in accordance with FCA regulatory requirements in 2026.
If you would like to proceed and visit this website, you acknowledge and confirm the following:
1.The website is owned by Ultima Markets’ international entities and not by Ultima Markets UK Ltd, which is regulated by the FCA.
2.Ultima Markets Limited, or any of the Ultima Markets international entities, are neither based in the UK nor licensed by the FCA.
3.You are accessing the website at your own initiative and have not been solicited by Ultima Markets Limited in any way.
4.Investing through this website does not grant you the protections provided by the FCA.
5.Should you choose to invest through this website or with any of the international Ultima Markets entities, you will be subject to the rules and regulations of the relevant international regulatory authorities, not the FCA.
Ultima Markets wants to make it clear that we are duly licensed and authorised to offer the services and financial derivative products listed on our website. Individuals accessing this website and registering a trading account do so entirely of their own volition and without prior solicitation.
By confirming your decision to proceed with entering the website, you hereby affirm that this decision was solely initiated by you, and no solicitation has been made by any Ultima Markets entity.
Learn the Accumulation Manipulation Distribution (AMD) trading strategy, how it works, and ways traders use it to spot market moves.
What Is Accumulation Manipulation Distribution (AMD) Trading?
Accumulation Manipulation Distribution (AMD) Trading is a market cycle theory where institutional traders accumulate positions, manipulate price to create false moves, then distribute for profit. It helps retail traders identify smart money behavior and avoid traps in forex, stocks, and crypto markets.
In simple terms, AMD is a trading method that shows how big players buy quietly (accumulation), trick the market with false moves (manipulation), and then sell for profit (distribution). It helps traders spot market traps and trade smarter.
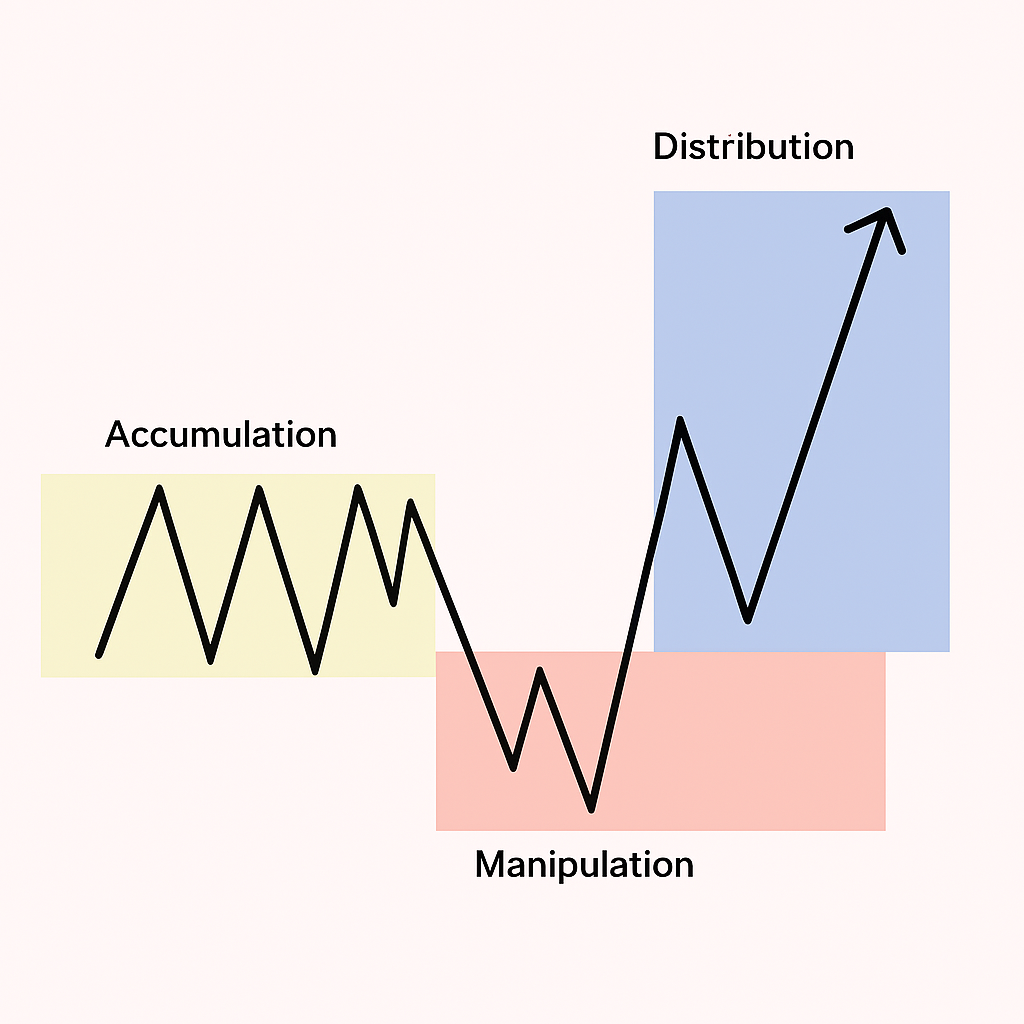
Three Phases of AMD Explained
The Accumulation Manipulation Distribution (AMD) model is rooted in the belief that markets are not always random. Instead, they are often guided by institutions with large capital. These entities cannot place large trades at once without moving the price, so they follow a cycle like accumulation, manipulation and distribution phases.
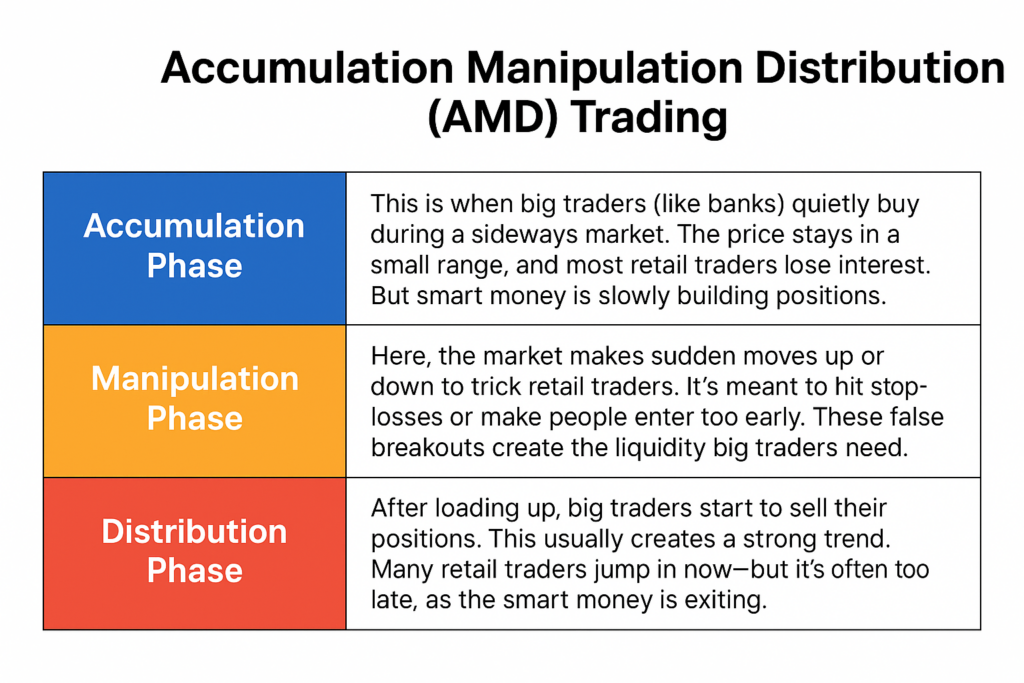
Accumulation Phase During accumulation, institutions gradually build positions when the market is flat or consolidating. Volume is usually low to medium, and price ranges within tight support and resistance levels. Retail traders often lose patience here, but smart money sees opportunity.
In simple terms, this is when big traders (like banks) quietly buy during a sideways market. The price stays in a small range, and most retail traders lose interest. But smart money is slowly building positions.
Manipulation Phase This phase involves false moves like sudden spikes or dips designed to trap retail traders. Stop-hunting and news-driven manipulation are common tactics. The aim is to induce panic or greed and create liquidity.
Distribution Phase Once large positions are filled, institutions begin the distribution process, pushing prices in the desired direction to offload trades at a profit. This is often when strong trends emerge and retail traders jump in too late.
How to Identify AMD in Trading (Step-by-Step)
Spotting the AMD cycle isn’t about guessing, it’s about reading the market behavior before, during, and after each phase. Here’s how to do it:
Spot Accumulation with Range-Bound Price and Flat Volume
What to look for:
Sideways price movement: Price stays inside a tight range for an extended period (e.g., during Asian sessions).
Low to moderate volume: Institutions don’t rush entries — they build positions quietly.
False signals: Indicators like RSI or MACD stay neutral.
Lack of trend: No clear higher highs or lower lows.
Example: EUR/USD ranging between 1.0850–1.0880 for 8–12 hours, often during low-volume sessions.
Detect Manipulation with Fake Breakouts and Spikes
What to look for:
Sudden breakout of the range: Price briefly breaks support/resistance but reverses quickly.
Stop-hunting wicks: Sharp candle wicks that grab stops above/below structure.
News catalysts: Moves that happen right after a news release or market open.
Divergence: Price makes a new high or low, but momentum indicators (RSI, MACD) do not confirm.
Example: GBP/USD spikes above 1.3000 after NFP news, then quickly crashes below 1.2950.
Confirm Distribution with Strong Trend + Volume Surge
What to look for:
Breakout with follow-through: Unlike manipulation, this move sustains beyond previous highs/lows.
Volume increases sharply: Big players are offloading.
Clean structure: Price forms clear lower highs (in sell-offs) or higher lows (in rallies).
Retail entry spike: Sentiment shifts, many traders enter too late.
Example: After manipulation fails, USD/JPY breaks cleanly below 140.00 with volume surge and forms lower highs.
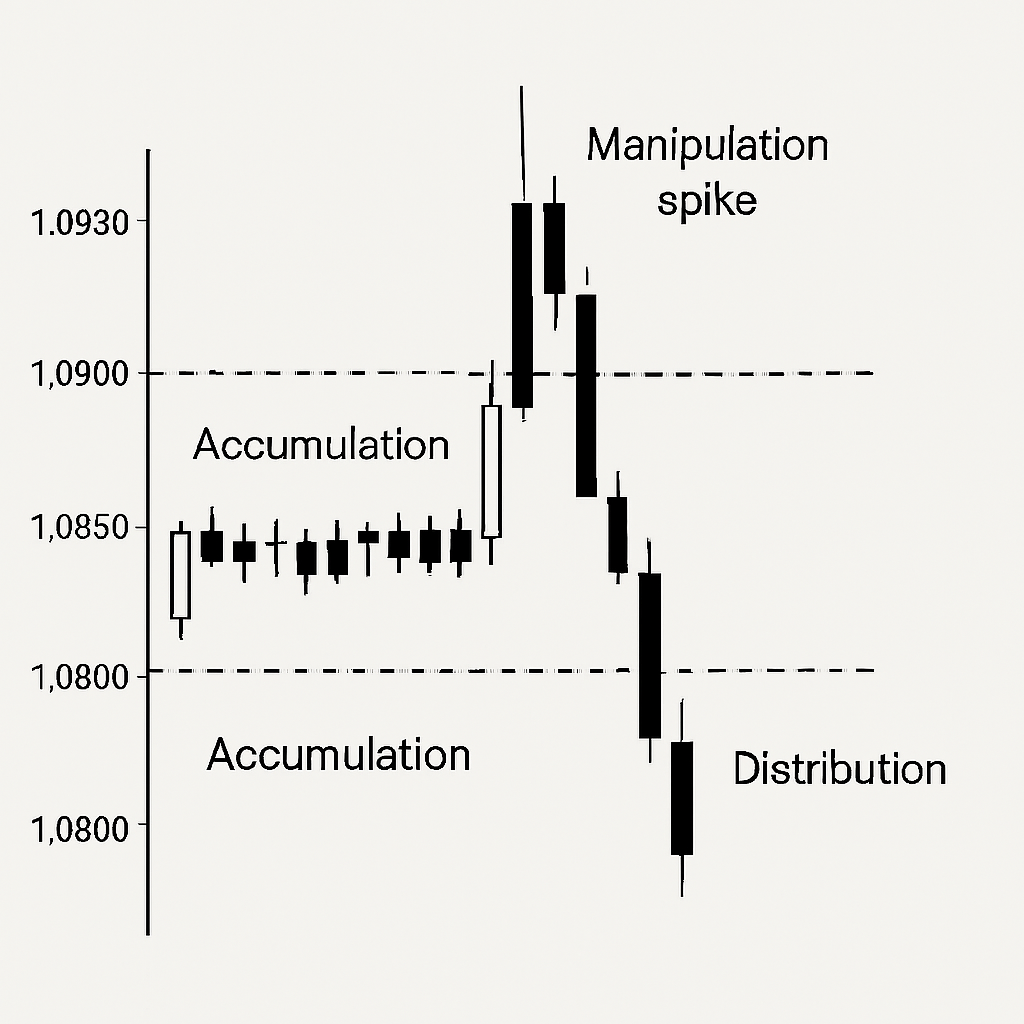
Example of AMD in Action
In forex, suppose EUR/USD consolidates between 1.0850–1.0900 for several sessions. Suddenly, a fake breakout to 1.0930 occurs before sharply dropping to 1.0800. This classic AMD setup includes:
Accumulation at 1.0850–1.0900
Manipulation spike to 1.0930
Distribution drop to 1.0800
Traders who understood the pattern could short near 1.0920 with tight stops and ride the trend.
Accumulation Manipulation Distribution (AMD) Trading Strategies
Understanding the AMD phases is powerful but knowing how to trade them is where the real edge comes in. Below are several practical strategies based on each AMD phase:
Trap-and-Fade Strategy (Used During Manipulation Phase) This strategy waits for the manipulation (fake breakout) to happen then enters in the opposite direction.
How it works:
Identify a strong range or previous high/low level.
Wait for price to break out and quickly return (a fakeout).
Enter in the opposite direction with a tight stop above/below the fakeout wick.
Why it works: Institutions create these moves to trigger retail stop-losses. Fading that move aligns you with smart money.
Breakout Confirmation Strategy (Used in Distribution Phase) Instead of jumping on the first breakout, this strategy waits for clear confirmation that the move is real.
How it works:
Identify breakout after manipulation.
Wait for a pullback to structure (previous support/resistance).
Enter after a candle closes in the direction of the trend, ideally with rising volume.
Why it works: Avoids getting trapped by manipulation and joins when the market commits.
Volume Profile & Re-entry Strategy (Used in Accumulation + Distribution) Use volume zones to see where institutions are likely entering or exiting.
How it works:
Use a volume profile tool to find high-volume nodes.
Watch price return to that level during a pullback.
Enter when price holds that level and confirms with price action (like pin bars or engulfing candles).
Why it works: Volume shows where smart money has interest. These areas often act as support or resistance later.
AMD + Session Timing Strategy AMD cycles often play out based on market sessions, especially in forex.
How it works:
Accumulation during Asian session.
Manipulation around London open.
Distribution during London–New York overlap.
Why it works: Institutions time their phases around liquidity, which increases during these sessions.
Combining AMD with smart risk management and macro awareness improves win rates significantly.
AMD in Forex vs Other Markets
AMD patterns appear in various markets, but their characteristics differ:
Forex: More frequent due to 24-hour market, especially during session overlaps (like London–New York).
Stocks: Common in small caps where price manipulation is easier due to lower liquidity.
Crypto: Heavily manipulated due to low regulation and high volatility.
Understanding how AMD plays out in different markets lets you adjust your entry timing, risk management, and confirmation tools. Each market has its own rhythm, but the smart money’s behavior stays the same.
Conclusion
For serious traders, the Accumulation Manipulation Distribution (AMD) is more than a theory, it’s a framework to trade with the market’s real movers. Instead of chasing indicators, AMD allows traders to align with institutional flows, improving timing, accuracy, and confidence. It reinforces the idea that patience, observation, and timing outweigh constant trading.
For deeper market insights, faster execution, and tools that support AMD-based strategies, trade with Ultima Markets, your trusted, regulated trading partner.
Share Now
Disclaimer:This content is provided for informational purposes only and does not constitute, and should not be construed as, financial, investment, or other professional advice. No statement or opinion contained herein should be considered a recommendation by Ultima Markets or the author regarding any specific investment product, strategy, or transaction. Readers are advised not to rely solely on this material when making investment decisions and should seek independent advice where appropriate.
Thank you for visiting the Ultima Markets website. Please note that this website is intended for individuals residing in jurisdictions where access is permitted by law. Ultima and its affiliated entities do not operate in your home jurisdiction.
By clicking ‘Acknowledge’, you confirm that you are entering this website solely on your own initiative and not as a result of any specific marketing outreach. You wish to obtain information from this website based on reverse solicitation principles, in accordance with the applicable laws of your home jurisdiction.