
Ultima Markets App
Trade Anytime, Anywhere
Important Information
This website is managed by Ultima Markets’ international entities, and it’s important to emphasise that they are not subject to regulation by the FCA in the UK. Therefore, you must understand that you will not have the FCA’s protection when investing through this website – for example:
- You will not be guaranteed Negative Balance Protection
- You will not be protected by FCA’s leverage restrictions
- You will not have the right to settle disputes via the Financial Ombudsman Service (FOS)
- You will not be protected by Financial Services Compensation Scheme (FSCS)
- Any monies deposited will not be afforded the protection required under the FCA Client Assets Sourcebook. The level of protection for your funds will be determined by the regulations of the relevant local regulator.
Note: Ultima Markets is currently developing a dedicated website for UK clients and expects to onboard UK clients under FCA regulations in 2026.
If you would like to proceed and visit this website, you acknowledge and confirm the following:
- 1.The website is owned by Ultima Markets’ international entities and not by Ultima Markets UK Ltd, which is regulated by the FCA.
- 2.Ultima Markets Limited, or any of the Ultima Markets international entities, are neither based in the UK nor licensed by the FCA.
- 3.You are accessing the website at your own initiative and have not been solicited by Ultima Markets Limited in any way.
- 4.Investing through this website does not grant you the protections provided by the FCA.
- 5.Should you choose to invest through this website or with any of the international Ultima Markets entities, you will be subject to the rules and regulations of the relevant international regulatory authorities, not the FCA.
Ultima Markets wants to make it clear that we are duly licensed and authorised to offer the services and financial derivative products listed on our website. Individuals accessing this website and registering a trading account do so entirely of their own volition and without prior solicitation.
By confirming your decision to proceed with entering the website, you hereby affirm that this decision was solely initiated by you, and no solicitation has been made by any Ultima Markets entity.
I confirm my intention to proceed and enter this website Please direct me to the website operated by Ultima Markets , regulated by the FCA in the United Kingdom

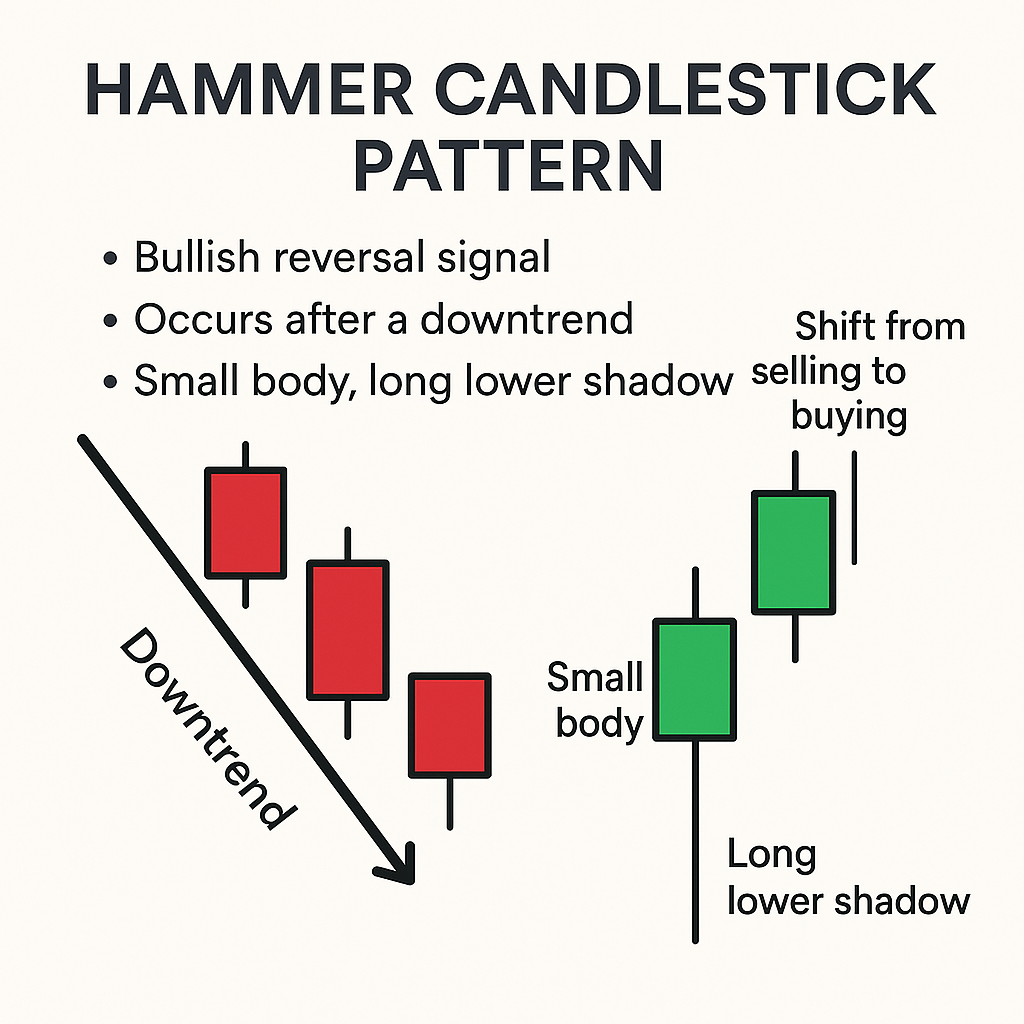
What is a Hammer Candlestick?
A Hammer Candlestick is a single-bar bullish reversal pattern that typically appears at the bottom of a downtrend. It signals that selling pressure has potentially subsided and buyers may be regaining control. The pattern gets its name from its distinct shape, a small body at the top with a long lower wick, resembling a hammer.
This formation is crucial for traders looking to identify potential trend reversals and high-probability entries in the market.
How to Identify Hammer Candlestick Pattern
Identifying a Hammer Candlestick Pattern involves more than just spotting a candle with a long wick. Traders need to analyze its structure, location, and context within the trend to ensure the signal is valid. Here’s a step-by-step breakdown:
Location in a Downtrend
A valid Hammer Candlestick Pattern must appear after a downtrend or a price pullback. This location is critical because the pattern signals a potential bullish reversal, and if there’s no prior decline, the pattern loses its meaning.
Small Real Body
The real body (the difference between the open and close) should be small and positioned near the top of the candle. This shows that although sellers pushed the price down during the session, buyers regained control before the close. A small real body indicates indecision or a shift in momentum.
Long Lower Shadow (Tail)
The lower wick or shadow must be at least twice the length of the real body. This long tail shows that sellers drove the price lower, but buyers absorbed the pressure and pushed it back up before the candle closed. This shadow represents rejection of lower prices, a bullish signal.
Little or No Upper Shadow
A true Hammer Candlestick will have no or minimal upper wick. This further confirms that the close happened near the high, reinforcing bullish momentum at the session’s end.
Volume Confirmation (Optional but Helpful)
Though not a visual part of the candle itself, increased volume during the formation of a hammer candlestick adds credibility to the pattern. It suggests strong buying interest and institutional support.
Confirmation on the Next Candle
Professional traders often wait for the next candle to close above the hammer’s high. This follow-through acts as confirmation that buyers are indeed in control.
- A candle closing above the hammer’s high = bullish confirmation
- A candle closing below or flat = signal is weak or invalid
What Does a Red Hammer Candlestick Mean?
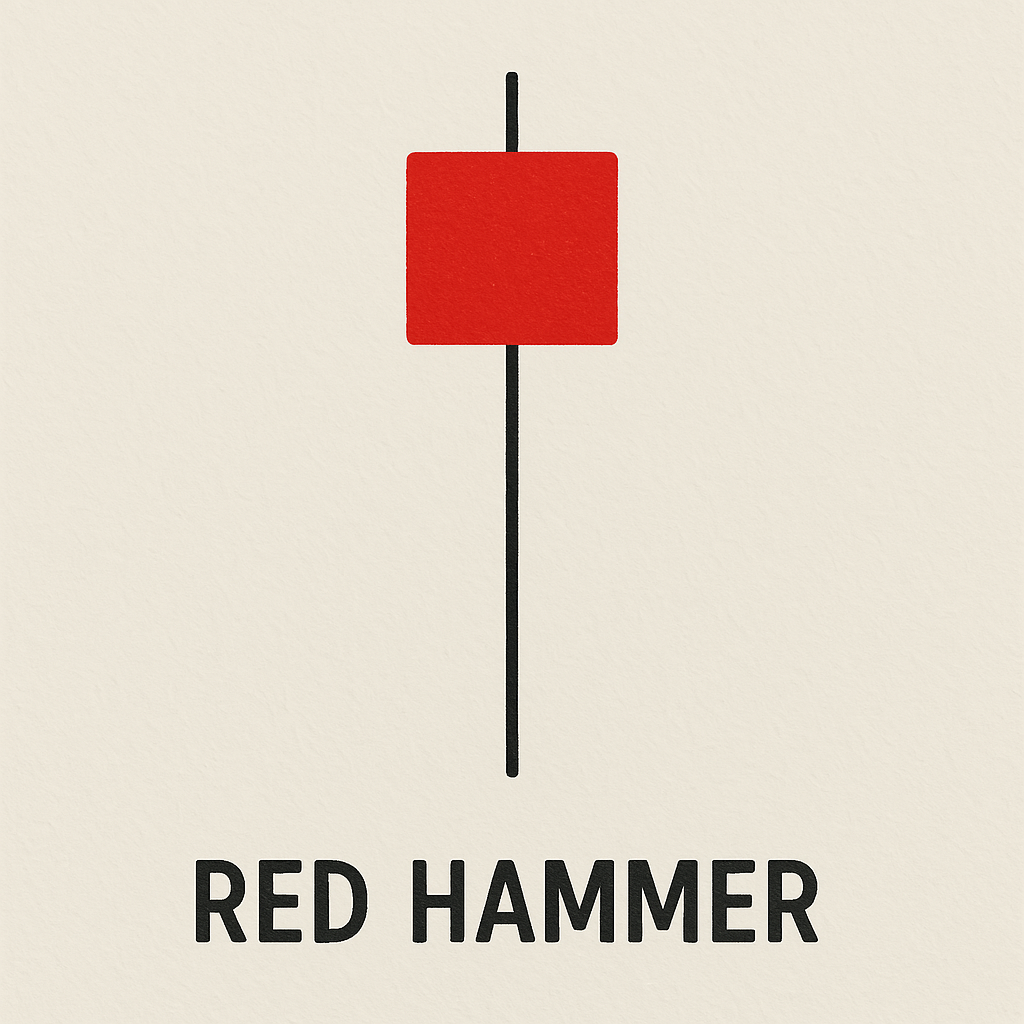
A Red Hammer Candlestick means that although the candle closed lower than it opened (bearish close), there was strong intraday buying pressure that rejected lower prices. This creates a long lower shadow, which signals a potential bullish reversal, especially when it appears after a downtrend.
A Red Hammer Candlestick Means:
- Sellers dominated early in the session, driving the price lower.
- Buyers stepped in aggressively, pushing the price back up before the close.
- The candle closed below the open (red body), showing weaker buyer strength than a green hammer.
- Despite the bearish close, the pattern still suggests that momentum may shift upward, if confirmed by the next candle.
What Does a Green Hammer Candlestick Mean?
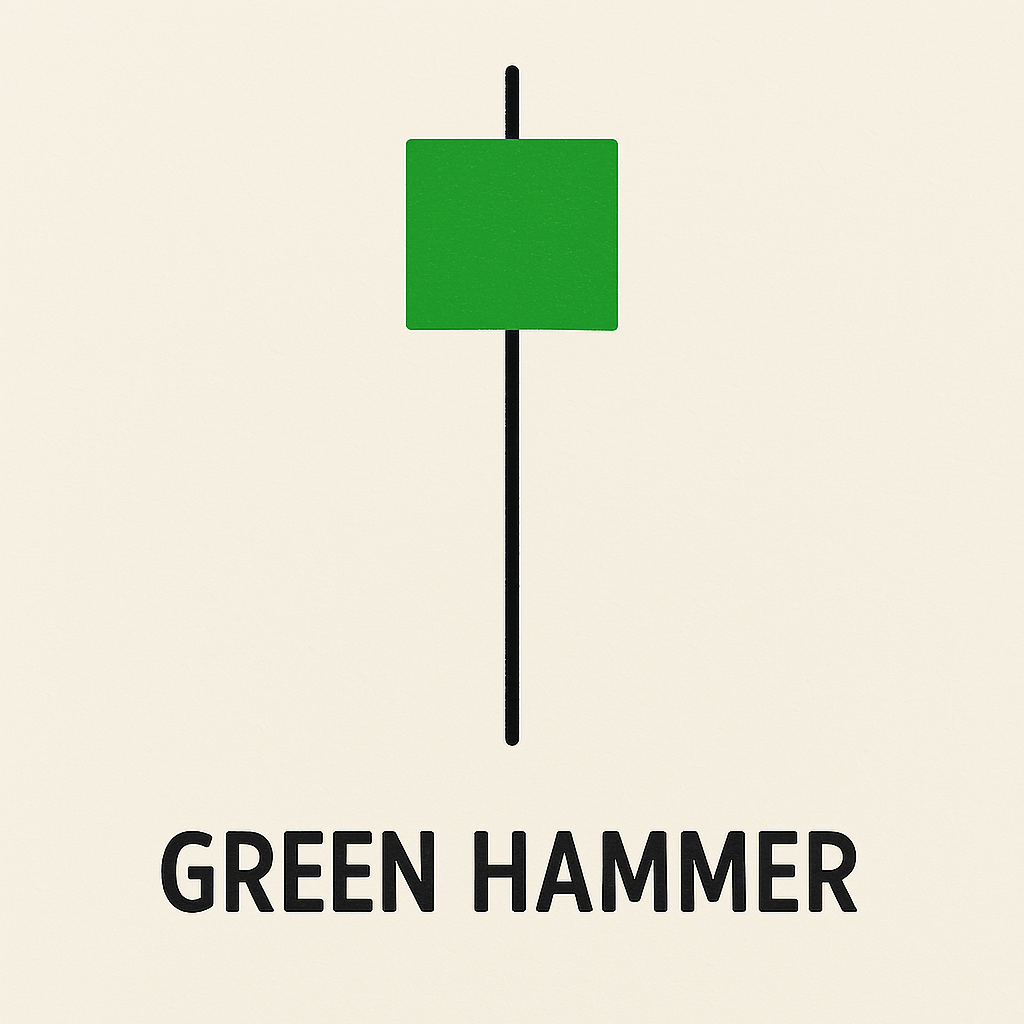
A Green Hammer Candlestick means that buyers successfully rejected lower prices and managed to close the session above the opening price, forming a bullish candle. This pattern signals a strong potential reversal when it appears after a downtrend.
A Green Hammer Candlestick Means:
- Price opened, dropped significantly, but then buyers pushed it back up.
- The session ended bullish, with a close above the open.
- The long lower shadow shows rejection of lower levels.
- The green body adds strength and momentum to the bullish signal.
Compared to a red hammer, a green hammer shows stronger buying pressure and gives traders more confidence in a potential trend reversal. It is often used as an entry signal when confirmed by the next candle closing higher.
Bullish Hammer Candlestick Pattern- What It Tells Traders
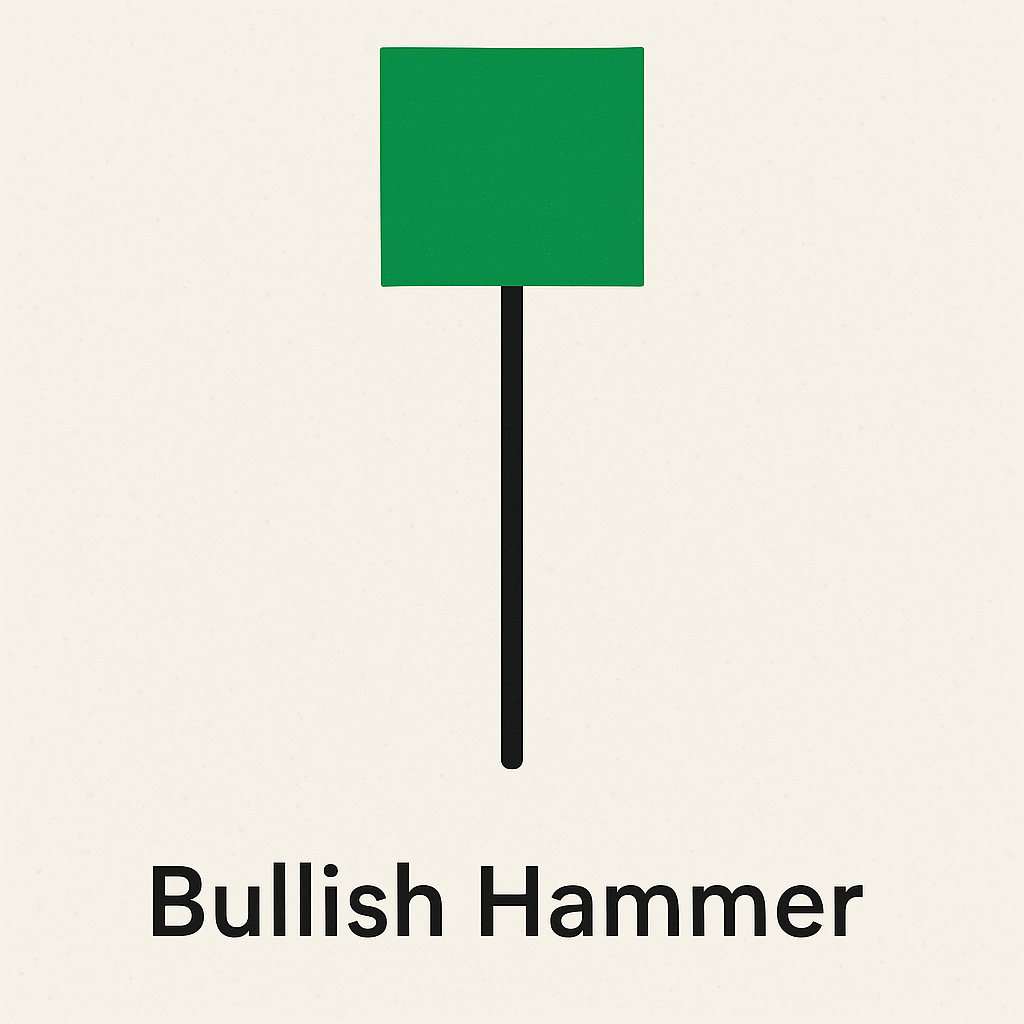
A Bullish Hammer suggests that the market rejected lower prices and buyers are stepping in. It reflects market exhaustion among sellers and offers a potential long entry when confirmed by volume or follow-through price action.
Traders often wait for the next candle to close above the Hammer’s high before entering a trade. This helps avoid false signals.
Bearish Hammer Candlestick Pattern- Myth or Misunderstood?
Technically, there is no true bearish hammer. However, traders sometimes confuse a Shooting Star (same shape but at the top of an uptrend) with a bearish hammer. A red Hammer itself is not bearish. It’s still a bullish reversal signal, just with less strength.
Don’t interpret a Hammer as bearish just because it’s red. Context is key.
How to Trade a Hammer Candlestick Pattern
The Hammer Candlestick Pattern is a signal that the market might be ready to go up — especially after a downtrend. If you see one, here’s how you can trade it step by step:
Step 1: Spot the Hammer
Look for a candle that has:
- A small body near the top
- A long lower wick (tail)
- Appears after the price has been falling
This shows that sellers tried to push the price down, but buyers fought back hard.
Step 2: Wait for Confirmation
Don’t jump in right away. Wait for the next candle to close higher than the hammer’s high. That tells you buyers are likely taking control.
Step 3: Plan Your Entry
Once confirmed, you can place a buy order just above the high of the hammer. This way, you only enter the trade if the price keeps rising.
Step 4: Set Your Stop-Loss
To protect yourself in case the trade goes wrong, place a stop-loss below the low of the hammer. This limits how much you can lose.
Step 5: Set Your Profit Target
You can aim for:
- A nearby resistance level (an area where price often stops rising)
- Or use a risk-reward ratio like 1:2, meaning for every $1 you risk, try to make $2 profit.
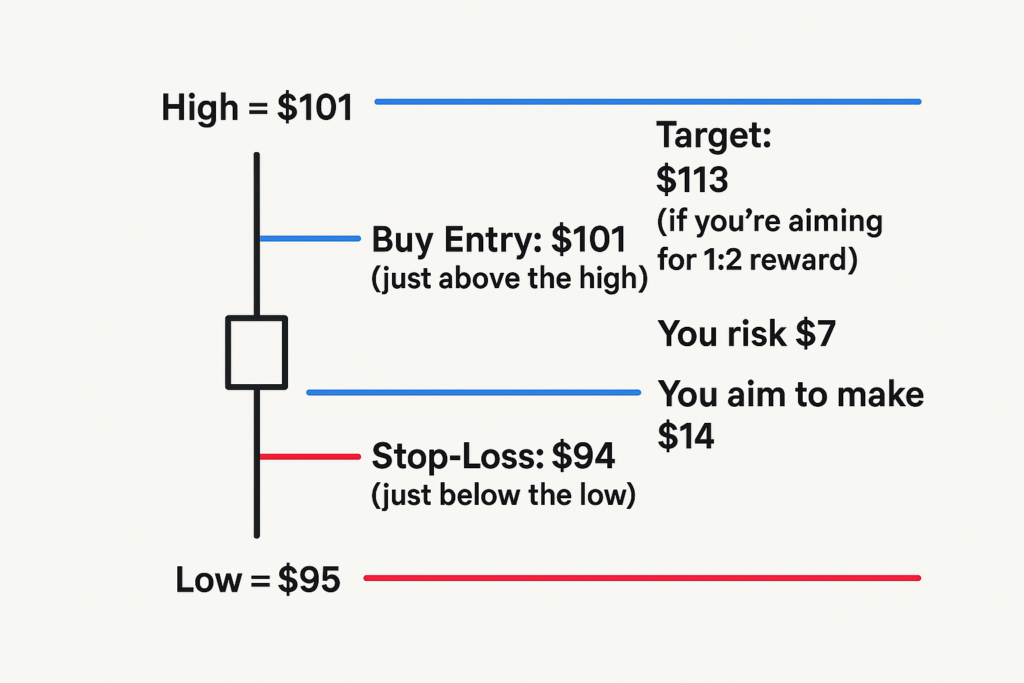
Let’s say a hammer forms:
- High = $100
- Low = $95
Here’s how your trade might look:
- Buy Entry: $101 (just above the high)
- Stop-Loss: $94 (just below the low)
- Target: $113 (if you’re aiming for 1:2 reward)
This means:
- You risk $7
- You aim to make $14
Why the Hammer Candlestick Pattern Matters to Traders
Traders use Hammer Candlestick patterns to:
- Identify trend reversal zones early
- Time entries with low-risk/high-reward potential
- Add confirmation to other technical indicators (e.g., RSI divergence, support zones)
Combined with volume analysis, hammers are powerful reversal signals in both forex and stock markets.
Conclusion
The Hammer Candlestick Pattern is a powerful tool for identifying bullish reversal opportunities after a downtrend. Whether it’s green or red, the hammer signals that buyers are stepping in and rejecting lower prices, a potential turning point in the market.
While a green hammer shows stronger bullish sentiment, even a red hammer can be effective when confirmed by the next candle.
By understanding how to identify, interpret, and trade the hammer candlestick pattern, traders can improve their timing, manage risk better, and spot high-probability setups across forex, stocks, and crypto markets.
For a more confident trading experience with advanced charting tools, real-time insights, and educational support, trade with Ultima Markets, your trusted trading partner.
Disclaimer: This content is provided for informational purposes only and does not constitute, and should not be construed as, financial, investment, or other professional advice. No statement or opinion contained here in should be considered a recommendation by Ultima Markets or the author regarding any specific investment product, strategy, or transaction. Readers are advised not to rely solely on this material when making investment decisions and should seek independent advice where appropriate.
Latest Articles

FOLLOW US


Ultima Markets is a member of The Financial Commission, an international independent body responsible for resolving disputes in the Forex and CFD markets.
All clients of Ultima Markets are protected under insurance coverage provided by Willis Towers Watson (WTW), a global insurance brokerage established in 1828, with claims eligibility up to US$1,000,000 per account.
Ultima Markets is the first United CFD broker to be part of the United Nations Global Compact.
FOLLOW US
TRADE WITH US
RISK DISCLOSURE
Risk Warning:
Trading leveraged financial products, including Contracts for Difference (CFDs), carries a high level of risk and may result in losses exceeding your initial investment. These products are not suitable for all investors and should only be traded with funds you can afford to lose. You do not own or have any rights to the underlying assets of these derivatives (e.g., entitlement to dividends). Please ensure you fully understand the associated risks. Before trading, consider your level of experience, investment objectives, and seek independent financial advice if necessary. Refer to our legal documents and disclosures before making any trading decisions.
General Advice Warning:
The information provided on this website is general in nature and does not take into account your personal objectives, financial situation, or needs. Before acting on any advice, you should assess its appropriateness in light of your individual circumstances and consult our legal documentation.
Regional Restrictions:
The information and services on this website are not intended for residents of certain jurisdictions, including but not limited to the United States, United Kingdom, Singapore, and any jurisdictions subject to international sanctions. For further information, please contact our customer support team.
Regulatory Information:
Ultima Markets is a trading name shared amongst multiple entities operating in various jurisdictions. These following entities are authorised to operate under the Ultima Markets brand and trademarks.
-
Ultima Markets UK Limited, reference number 470325, is authorised and regulated by the Financial Conduct Authority (FCA). Registered address: 1 Blossom Yard, Fourth Floor, London, E1 6RS, UNITED KINGDOM.
-
Ultima Markets Ltd is authorised and regulated by the Financial Services Commission (FSC) of Mauritius as a Full-Service Investment Dealer (excluding Underwriting), under licence number GB 23201593.
Registered address: 2nd Floor, The Catalyst, 40 Silicon Avenue, Ebene Cybercity, 72201, Mauritius.
Copyright © 2026 Ultima Markets Ltd. All rights reserved.
-

Messenger


Continue on Messenger
Take the conversation to your Messenger account. You can return anytime.
Scan the QR code and then send the message that appears in your Messenger.
Open Messenger on this device.
-

Instagram

Continue on Instagram
Take the conversation to your Instagram account. You can return anytime.
Scan the QR code to open Instagram. Follow @ultima_markets to send a DM.
Open Instagram on this device.
-

Live Chat
-
