Important Information
This website is managed by Ultima Markets’ international entities, and it’s important to emphasise that they are not subject to regulation by the FCA in the UK. Therefore, you must understand that you will not have the FCA’s protection when investing through this website – for example:
- You will not be guaranteed Negative Balance Protection
- You will not be protected by FCA’s leverage restrictions
- You will not have the right to settle disputes via the Financial Ombudsman Service (FOS)
- You will not be protected by Financial Services Compensation Scheme (FSCS)
- Any monies deposited will not be afforded the protection required under the FCA Client Assets Sourcebook. The level of protection for your funds will be determined by the regulations of the relevant local regulator.
Note: Ultima Markets is currently developing a dedicated website for UK clients and expects to onboard UK clients under FCA regulations in 2026.
If you would like to proceed and visit this website, you acknowledge and confirm the following:
- 1.The website is owned by Ultima Markets’ international entities and not by Ultima Markets UK Ltd, which is regulated by the FCA.
- 2.Ultima Markets Limited, or any of the Ultima Markets international entities, are neither based in the UK nor licensed by the FCA.
- 3.You are accessing the website at your own initiative and have not been solicited by Ultima Markets Limited in any way.
- 4.Investing through this website does not grant you the protections provided by the FCA.
- 5.Should you choose to invest through this website or with any of the international Ultima Markets entities, you will be subject to the rules and regulations of the relevant international regulatory authorities, not the FCA.
Ultima Markets wants to make it clear that we are duly licensed and authorised to offer the services and financial derivative products listed on our website. Individuals accessing this website and registering a trading account do so entirely of their own volition and without prior solicitation.
By confirming your decision to proceed with entering the website, you hereby affirm that this decision was solely initiated by you, and no solicitation has been made by any Ultima Markets entity.
I confirm my intention to proceed and enter this website

What Is the A50 Index? Mastering Key Trading Strategies
The A50 Index, compiled by FTSE Russell, is a China A-share index comprising the 50 largest constituent stocks by market capitalization on the Shanghai and Shenzhen exchanges. These companies span key sectors like finance, consumer goods, and technology, characterized by high market caps and liquidity.
The A50 Index serves as a critical benchmark for international institutions evaluating China’s market and a core indicator for global capital allocation.
Whether investing via ETFs or leveraged trading through futures products, understanding the A50 Index’s composition and fluctuations is essential for effectively gauging China’s economic pulse.
Characteristics of A50 Index Constituent Stocks
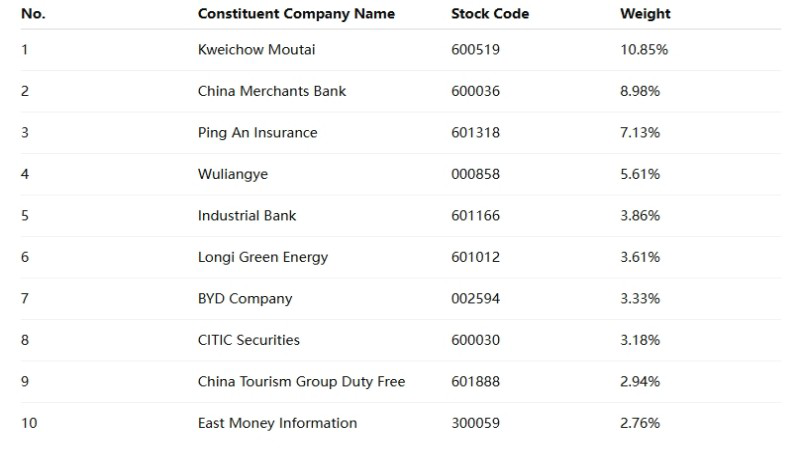
A50 Index constituents are predominantly large-cap blue-chip enterprises, such as Kweichow Moutai, Ping An Insurance, and China Merchants Bank, holding pivotal roles in China’s economy.
These companies typically demonstrate robust financial health, industry leadership, and high liquidity with active trading in the A-share market. Constituents are rebalanced quarterly to ensure the index reflects current core market players.
Monitoring A50 Index trends helps investors track blue-chip sector movements and identify shifts in China’s policy directions and industrial priorities.

Comparison Between A50 Index and CSI 300 Index
The table below highlights key differences:
| Items | A50 Index | CSI 300 Index |
| Constituent Count | 50 stocks | 300 stocks |
| Sector Focus | Finance, Tech, Consumer Blue-chips | Broad industry coverage |
| Market Response | Rapid, reflects market leaders | Steady, reflects overall trend |
| Investment Profile | High volatility, short-term | Stable, medium/long-term |
| Representation | China’s core enterprises | Mainstream corporate group |
Based on 2023 data, the A50 Index rose ~8% versus CSI 300’s ~6%, indicating higher sensitivity to market trends for efficiency-focused strategies.

How to Trade Using A50 Index Futures
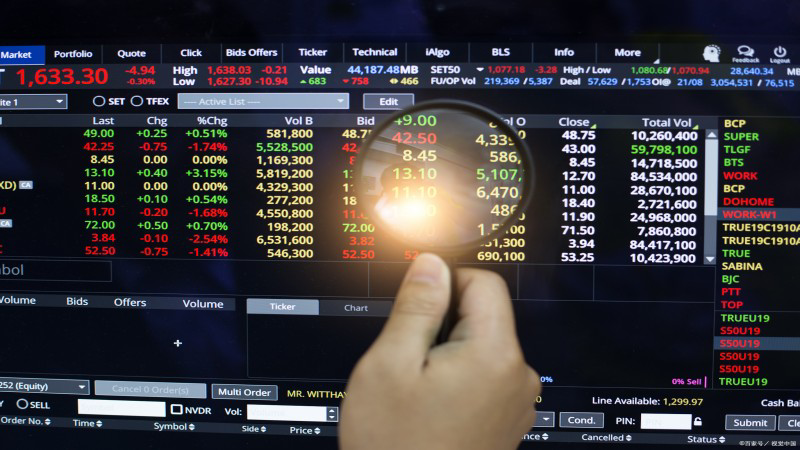
A50 Index Futures bridge domestic and international markets, traded on the Singapore Exchange (SGX), enabling global leveraged trading.Compared to spot markets, futures offer margin systems and T+0 advantages, allowing long-short positions ideal for short-term strategies and hedging needs.Through professional platforms like Ultima Markets’ trading account, investors access real-time quotes, order execution, and risk controls to seize optimal entry/exit timing.
A50 Index Futures Trading Strategy Recommendations
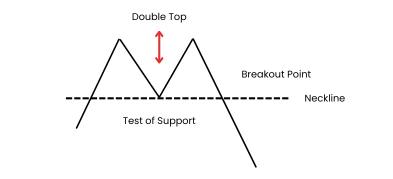
During significant market volatility, utilize technical analysis to identify breakout signals for short-term trades.
For example, in Q3 2023, one investor observed the A50 Index breaching short-term support followed by a swift rebound. Combining this with a MACD bullish crossover signal, they reversed to long positions, securing 6% returns within two weeks.
When China introduced new domestic stimulus policies, another investor established medium-term long positions with trailing stop-loss orders, effectively locking in extended gains.
These strategies, when applied with the UM platform’s real-time charts and stop-loss functions, significantly enhance trade success rates and risk management capabilities.
Importance of A50 Index Technical Analysis
Beyond fundamentals, technical analysis is vital for identifying A50 Index turning points. Indicators like Moving Averages, MACD, and RSI help determine bull-bear trends and price rhythms.
For example, when the 5-day moving average crosses above the 20-day moving average accompanied by increased trading volume, it is often seen as a bullish breakout signal. The MACD indicator can be used to observe divergence and momentum shifts, when the MACD and signal lines cross upward and continue to diverge, it indicates strengthening buying pressure in the market.
Using the UM platform for chart analysis not only offers a comprehensive set of indicators and customizable parameters but also supports automatic trendline drawing and pattern recognition, greatly enhancing decision-making efficiency.
A50 Index Investment Risk Assessment
Although the A50 Index is representative, its price remains influenced by multiple factors, such as policy shifts, economic data, and international capital flows, resulting in inherent volatility and uncertainty.
Additionally, due to the concentrated composition of the A50 Index, declining performance in leading enterprises may significantly drag down the overall index. Investors are advised to adopt staged fund allocation and risk hedging strategies, coupled with practical training via demo account, to enhance trading skills within a controlled-risk framework.
Methods to Reduce Investment Risk
Potential losses can be controlled by setting stop-loss levels, using leverage ratios not exceeding 3x, and monitoring policy risks.
Additionally, utilizing Ultima Markets’ trading alerts and trailing stop-loss/take-profit tools helps strengthen risk management execution, preventing emotional decision-making from causing misjudgment of market trends.
A50 Index Investment FAQs
Q: Does investing in the A50 Index require substantial capital?
A: No. Through leveraged trading instruments, participation is possible with minimal margin. However, maintaining a sufficient risk buffer is advised to reduce liquidation risk.
Q: Can beginners directly trade A50 futures?
A: Opening a demo account for practice is recommended. Familiarize yourself with market movements and order execution rhythm before transitioning to a trading account based on personal risk tolerance.
Q: How does the A50 Index differ from ETFs?
A: ETFs operate in physical form, suit mid-to-long-term holding, and offer stable liquidity; while futures are more appropriate for short-term trading and hedging purposes.
Q: Why choose UM for A50 Index trading?
A: UM provides ultra-low spreads, a stable trading environment, advanced charting tools, Chinese-language interface, and real-time customer support, making it ideal for both professional traders and beginners.
Conclusion
As a representative indicator of the Chinese market, the A50 Index serves as a critical tool for investors to observe and trade, whether through its constituent stock structure or market volatility response.
Through correct technical analysis and strategy deployment, investors can identify stable profit opportunities within the A50 Index’s fluctuations. Mastering the A50 Index means mastering the core artery of the Chinese market.
Disclaimer: This content is provided for informational purposes only and does not constitute, and should not be construed as, financial, investment, or other professional advice. No statement or opinion contained here in should be considered a recommendation by Ultima Markets or the author regarding any specific investment product, strategy, or transaction. Readers are advised not to rely solely on this material when making investment decisions and should seek independent advice where appropriate.
Latest Articles


FOLLOW US


Ultima Markets is a member of The Financial Commission, an international independent body responsible for resolving disputes in the Forex and CFD markets.
All clients of Ultima Markets are protected under insurance coverage provided by Willis Towers Watson (WTW), a global insurance brokerage established in 1828, with claims eligibility up to US$1,000,000 per account.
Ultima Markets is the first CFD broker to be part of United Nations Global Compact.
FOLLOW US
TRADE WITH US
RISK DISCLOSURE
Risk Warning:
Trading leveraged financial products, including Contracts for Difference (CFDs), carries a high level of risk and may result in losses exceeding your initial investment. These products are not suitable for all investors and should only be traded with funds you can afford to lose. You do not own or have any rights to the underlying assets of these derivatives (e.g., entitlement to dividends). Please ensure you fully understand the associated risks. Before trading, consider your level of experience, investment objectives, and seek independent financial advice if necessary. Refer to our legal documents and disclosures before making any trading decisions.
General Advice Warning:
The information provided on this website is general in nature and does not take into account your personal objectives, financial situation, or needs. Before acting on any advice, you should assess its appropriateness in light of your individual circumstances and consult our legal documentation.
Regional Restrictions:
The information and services on this website are not intended for residents of certain jurisdictions, including but not limited to the United States, Singapore, and any jurisdictions subject to international sanctions. For further information, please contact our customer support team.
Regulatory Information:
Ultima Markets is a trading name shared amongst multiple entities operating in various jurisdictions. These following entities are authorised to operate under the Ultima Markets brand and trademarks.
-
Ultima Markets UK Limited, reference number 470325, is authorised and regulated by the Financial Conduct Authority (FCA). Registered address: 1 Blossom Yard, Fourth Floor, London, E1 6RS, UNITED KINGDOM.
-
Ultima Markets Ltd is authorised and regulated by the Financial Services Commission (FSC) of Mauritius as a Full-Service Investment Dealer (excluding Underwriting), under licence number GB 23201593.
Registered address: 2nd Floor, The Catalyst, 40 Silicon Avenue, Ebene Cybercity, 72201, Mauritius.
Copyright © 2025 Ultima Markets Ltd. All rights reserved.
-

Messenger


Continue on Messenger
Take the conversation to your Messenger account. You can return anytime.
Scan the QR code and then send the message that appears in your Messenger.
Open Messenger on this device.
-

Instagram

Continue on Instagram
Take the conversation to your Instagram account. You can return anytime.
Scan the QR code to open Instagram. Follow @ultima_markets to send a DM.
Open Instagram on this device.
-

Live Chat
-
