Important Information
This website is managed by Ultima Markets’ international entities, and it’s important to emphasise that they are not subject to regulation by the FCA in the UK. Therefore, you must understand that you will not have the FCA’s protection when investing through this website – for example:
- You will not be guaranteed Negative Balance Protection
- You will not be protected by FCA’s leverage restrictions
- You will not have the right to settle disputes via the Financial Ombudsman Service (FOS)
- You will not be protected by Financial Services Compensation Scheme (FSCS)
- Any monies deposited will not be afforded the protection required under the FCA Client Assets Sourcebook. The level of protection for your funds will be determined by the regulations of the relevant local regulator.
Note: Ultima Markets is currently developing a dedicated website for UK clients and expects to onboard UK clients under FCA regulations in 2026.
If you would like to proceed and visit this website, you acknowledge and confirm the following:
- 1.The website is owned by Ultima Markets’ international entities and not by Ultima Markets UK Ltd, which is regulated by the FCA.
- 2.Ultima Markets Limited, or any of the Ultima Markets international entities, are neither based in the UK nor licensed by the FCA.
- 3.You are accessing the website at your own initiative and have not been solicited by Ultima Markets Limited in any way.
- 4.Investing through this website does not grant you the protections provided by the FCA.
- 5.Should you choose to invest through this website or with any of the international Ultima Markets entities, you will be subject to the rules and regulations of the relevant international regulatory authorities, not the FCA.
Ultima Markets wants to make it clear that we are duly licensed and authorised to offer the services and financial derivative products listed on our website. Individuals accessing this website and registering a trading account do so entirely of their own volition and without prior solicitation.
By confirming your decision to proceed with entering the website, you hereby affirm that this decision was solely initiated by you, and no solicitation has been made by any Ultima Markets entity.
I confirm my intention to proceed and enter this website

What is Gross Profit Margin and How to Calculate It?
In an increasingly competitive market environment, companies must accurately assess their profitability to achieve sustainable growth. The “gross profit margin” is one of the most straightforward and critical financial indicators for this purpose. By gaining an in-depth understanding of gross profit margin, businesses can precisely evaluate the effectiveness of cost control, the strength of their pricing strategies, and adjust their operational direction accordingly to ensure long-term stability.
This article will analyze the calculation and meaning of gross profit margin, explore the key factors that affect it, offer practical strategies for improvement, and present benchmarks and case studies from various industries to provide comprehensive reference tools for readers.

What is Gross Profit Margin and How Is It Calculated?
1. Definition and Calculation Formula
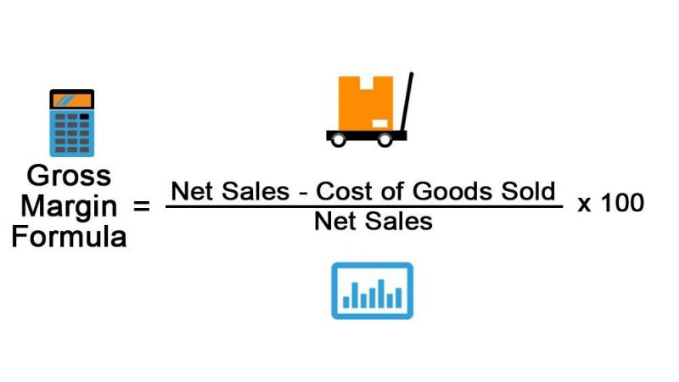
Gross profit margin refers to the percentage of revenue that remains after deducting direct costs. It is a key indicator used to evaluate how profitable a company’s products or services are. The calculation formula is:
(Gross Revenue − Cost of Goods Sold) / Gross Revenue × 100%
Cost of goods sold typically includes direct input costs such as raw materials, direct labor, and manufacturing overhead.
2. Difference from Other Profit Margins
- Operating profit margin: This deducts indirect costs such as selling, administrative, and R&D expenses from gross profit, making it lower than gross profit margin and more reflective of overall operational performance.
- Net profit margin: This is derived by further deducting interest and income taxes from operating profit, representing the final percentage of income retained for shareholders.
📌 Gross Profit Margin ≠ Net Profit Margin
In summary, while net profit margin also considers expenses such as operating costs, taxes, and interest, gross profit margin focuses solely on the gap between revenue and direct costs. It is particularly suited for assessing a company’s core business model.
The Importance of Gross Profit Margin
- Profitability Assessment: A higher gross profit margin indicates that each unit of revenue contributes more profit, reflecting stronger cost control and pricing power, which helps withstand market volatility.
- Pricing Strategy Guidance: By comparing with industry averages, businesses can assess whether their pricing is competitive and adjust product mix or promotional strategies accordingly.
- Supply Chain and Inventory Optimization: Gross profit margin reflects procurement and production efficiency, providing a quantitative basis for improving supply chains and inventory turnover.
What Factors Influence Gross Profit Margin?

Differences in gross profit margins across companies may stem from the following key factors:
1. Raw Materials and Manufacturing Costs
- Procurement prices and bargaining power: Fluctuations in bulk material costs significantly impact gross profit margins.
- Manufacturing efficiency and automation level: Automation can effectively reduce labor costs and defect rates.
2. Exchange Rate Fluctuations
Export-oriented companies (such as Taiwanese tech stocks) selling primarily to USD markets may see reduced exchange income when the USD/TWD rate drops, directly impacting gross profit.
3. Price Competition and Market Positioning
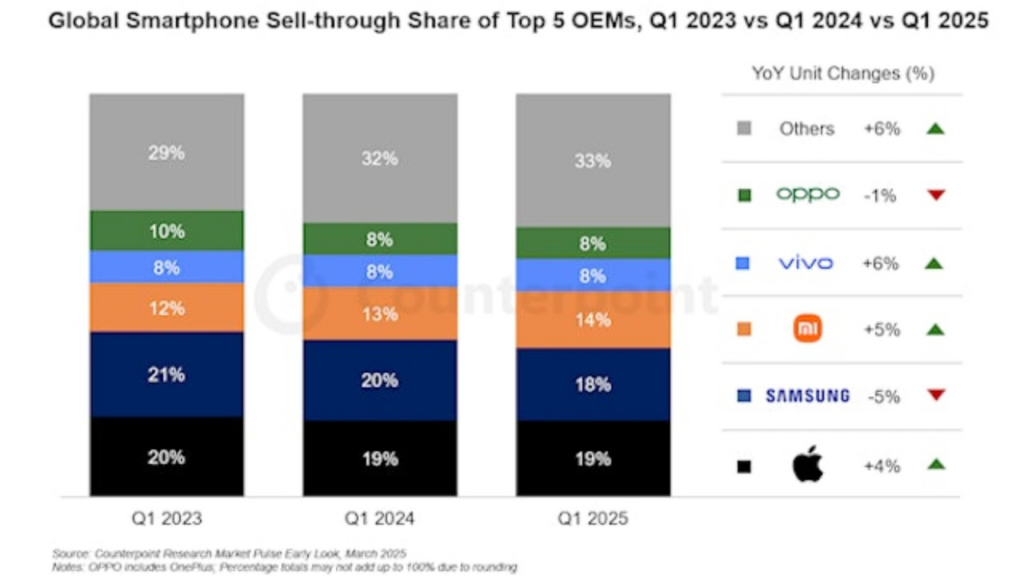
Brands with strong pricing power—such as Apple—tend to have above-average gross profit margins. In contrast, price-sensitive industries like retail typically exhibit lower margins.
Additionally, discounts and promotional campaigns may temporarily boost sales but erode margins—requiring careful balance.
4. Economies of Scale
The larger the scale, the lower the marginal cost. For example, large semiconductor foundries can spread fixed costs more efficiently, increasing their gross profit margin.
How to Improve Gross Profit Margin
1. Optimize Procurement and Production
- Centralize procurement and use long-term contracts to lock in costs.
- Implement automation and lean production to reduce waste and defect rates.
2. Adjust Product Portfolio
- Increase the proportion of high-margin products, and eliminate or upgrade low-margin offerings.
3. Strengthen Branding and Pricing Power
- Build brand equity and leverage differentiated marketing to enhance pricing power.
4. Refined Cost Management
- Regularly review cost structures, break down expense components, and continuously identify cost-reduction opportunities.
How Do Gross Profit Margins Vary by Industry?
Based on global financial data from 2025, gross profit margins vary significantly across industries:
| Industry Sector | Average Gross Margin (2025) | Description |
| Software / Cloud Services | 70%~85% | Low operating costs and stable subscription models |
| Semiconductors | 40%~55% | Technologically advanced, capital-intensive |
| Services | 50%+ | Low costs, high value-added |
| Manufacturing | 25%~40% | Affected by raw materials and exchange rates |
| Retail | 10%~20% | Intense price competition, margin pressure |
| F&B (Restaurants) | 5%~15% | High labor costs, volatile rent and consumables |
Investors should not blindly pursue “high gross margins,” but rather analyze them in context with the industry’s nature, growth potential, and operational strategies.
How to Apply Gross Profit Margin in Investing and Trading
Stock Fundamental Analysis
High gross margin companies often benefit from strong branding, technological barriers, or market dominance. For instance, Apple Inc.’s gross margin surged to a record 46.9% in Q1 2025, driven by its services segment reaching a 75.0% gross margin and a higher proportion of premium iPad and Mac models in its product mix. Investors should assess gross margin alongside indicators such as EPS and ROE for a comprehensive evaluation.
Application in CFD Trading
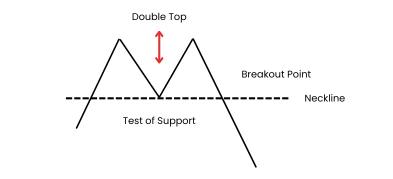
When trading individual stocks or index CFDs, monitoring a company’s gross profit margin trend can serve as a foundation for fundamental trading strategies. Consistent improvement in gross margin often indicates stable market demand or successful cost optimization, which may drive the stock price higher.
Using a professional platform like Ultima Markets allows you to access financial report analysis and apply tools such as Trading Central to support entry decisions.
Exchange Rates and Gross Margin: A Key Link for Forex Traders
For export-reliant companies, gross profit margins are highly sensitive to exchange rate fluctuations. Take Taiwan as an example:
- When the US dollar strengthens (USD/TWD rises), exporters gain more from currency conversion, improving their gross margins.
- When the New Taiwan dollar appreciates, export prices face pressure, leading to margin compression.
This allows forex traders to analyze margin trends in specific sectors or companies to anticipate corresponding currency movements, enabling cross-asset strategies (e.g., long USD + long tech exporter stock CFDs).
Why Choose Ultima Markets as Your Trading Platform?
As an all-in-one financial trading platform, Ultima Markets offers global stock CFDs, indices, commodities, and over 50 forex pairs, supported by a comprehensive suite of financial tools, including:
- Trading Central Smart Earnings Analysis: Quickly identify trends in gross margin changes
- MT4/MT5 multi-platform access: Real-time order execution with both technical and fundamental integration
- Demo account: Practice fundamental-driven strategies without a deposit
- Leverage up to 1:2000 for flexible capital allocation
- Daily market insights and economic calendar: Stay informed on earnings release schedules and their impact
Additionally, the UM platform uses segregated account structures and up to $1 million in extra insurance coverage to ensure fund safety and worry-free trading.
Common Pitfalls and Key Considerations
- Overreliance on Gross Margin: It only reflects the gap between direct costs and selling prices. Combine with operating and net profit margins for a full picture.
- Cross-industry comparisons: Cost structures and business models vary widely; compare within the same industry and company size.
- Ignoring seasonality and inventory swings: Seasonal demand and inventory write-downs can distort margins temporarily. Understand accounting treatment and cyclical effects.
Conclusion
Whether you’re a value investor or a short-term trader, gross profit margin is an essential analytical tool. It reveals a company’s competitive strength and provides a foundation for trading decisions.
Join Ultima Markets now, open a demo or trading account, and turn “gross margin” into a practical edge through professional tools and platforms!
Disclaimer: This content is provided for informational purposes only and does not constitute, and should not be construed as, financial, investment, or other professional advice. No statement or opinion contained here in should be considered a recommendation by Ultima Markets or the author regarding any specific investment product, strategy, or transaction. Readers are advised not to rely solely on this material when making investment decisions and should seek independent advice where appropriate.
Latest Articles


FOLLOW US


Ultima Markets is a member of The Financial Commission, an international independent body responsible for resolving disputes in the Forex and CFD markets.
All clients of Ultima Markets are protected under insurance coverage provided by Willis Towers Watson (WTW), a global insurance brokerage established in 1828, with claims eligibility up to US$1,000,000 per account.
Ultima Markets is the first CFD broker to be part of United Nations Global Compact.
FOLLOW US
TRADE WITH US
RISK DISCLOSURE
Risk Warning:
Trading leveraged financial products, including Contracts for Difference (CFDs), carries a high level of risk and may result in losses exceeding your initial investment. These products are not suitable for all investors and should only be traded with funds you can afford to lose. You do not own or have any rights to the underlying assets of these derivatives (e.g., entitlement to dividends). Please ensure you fully understand the associated risks. Before trading, consider your level of experience, investment objectives, and seek independent financial advice if necessary. Refer to our legal documents and disclosures before making any trading decisions.
General Advice Warning:
The information provided on this website is general in nature and does not take into account your personal objectives, financial situation, or needs. Before acting on any advice, you should assess its appropriateness in light of your individual circumstances and consult our legal documentation.
Regional Restrictions:
The information and services on this website are not intended for residents of certain jurisdictions, including but not limited to the United States, Singapore, and any jurisdictions subject to international sanctions. For further information, please contact our customer support team.
Regulatory Information:
Ultima Markets is a trading name shared amongst multiple entities operating in various jurisdictions. These following entities are authorised to operate under the Ultima Markets brand and trademarks.
-
Ultima Markets UK Limited, reference number 470325, is authorised and regulated by the Financial Conduct Authority (FCA). Registered address: 1 Blossom Yard, Fourth Floor, London, E1 6RS, UNITED KINGDOM.
-
Ultima Markets Ltd is authorised and regulated by the Financial Services Commission (FSC) of Mauritius as a Full-Service Investment Dealer (excluding Underwriting), under licence number GB 23201593.
Registered address: 2nd Floor, The Catalyst, 40 Silicon Avenue, Ebene Cybercity, 72201, Mauritius.
Copyright © 2025 Ultima Markets Ltd. All rights reserved.
-

Messenger


Continue on Messenger
Take the conversation to your Messenger account. You can return anytime.
Scan the QR code and then send the message that appears in your Messenger.
Open Messenger on this device.
-

Instagram

Continue on Instagram
Take the conversation to your Instagram account. You can return anytime.
Scan the QR code to open Instagram. Follow @ultima_markets to send a DM.
Open Instagram on this device.
-

Live Chat
-
