This website is managed by Ultima Markets’ international entities, and it’s important to emphasise that they are not subject to regulation by the FCA in the UK. Therefore, you must understand that you will not have the FCA’s protection when investing through this website – for example:
You will not be guaranteed Negative Balance Protection
You will not be protected by FCA’s leverage restrictions
You will not have the right to settle disputes via the Financial Ombudsman Service (FOS)
You will not be protected by Financial Services Compensation Scheme (FSCS)
Any monies deposited will not be afforded the protection required under the FCA Client Assets Sourcebook. The level of protection for your funds will be determined by the regulations of the relevant local regulator.
Note: UK clients are kindly invited to visit https://www.ultima-markets.co.uk/. Ultima Markets UK expects to begin onboarding UK clients in accordance with FCA regulatory requirements in 2026.
If you would like to proceed and visit this website, you acknowledge and confirm the following:
1.The website is owned by Ultima Markets’ international entities and not by Ultima Markets UK Ltd, which is regulated by the FCA.
2.Ultima Markets Limited, or any of the Ultima Markets international entities, are neither based in the UK nor licensed by the FCA.
3.You are accessing the website at your own initiative and have not been solicited by Ultima Markets Limited in any way.
4.Investing through this website does not grant you the protections provided by the FCA.
5.Should you choose to invest through this website or with any of the international Ultima Markets entities, you will be subject to the rules and regulations of the relevant international regulatory authorities, not the FCA.
Ultima Markets wants to make it clear that we are duly licensed and authorised to offer the services and financial derivative products listed on our website. Individuals accessing this website and registering a trading account do so entirely of their own volition and without prior solicitation.
By confirming your decision to proceed with entering the website, you hereby affirm that this decision was solely initiated by you, and no solicitation has been made by any Ultima Markets entity.
Learn how to identify and trade the bullish rectangle pattern, complete with chart examples, strategy tips, and target projections.
What Is a Bullish Rectangle Pattern & How to Use
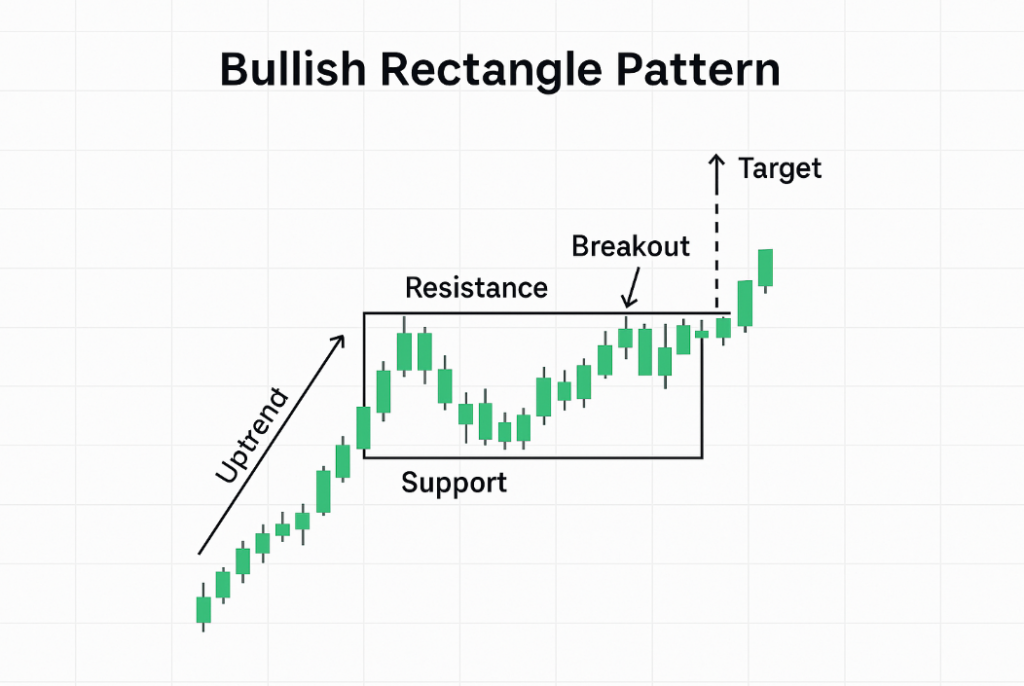
A bullish rectangle pattern occurs during an existing uptrend when the price consolidates between two horizontal levels like support and resistance before eventually breaking out upwards. This pattern reflects a temporary pause in the market, where buyers and sellers are in equilibrium, often preceding a continuation of the bullish trend.
This sideways movement forms a rectangular shape on the chart, hence the name. It typically signals that the market is accumulating momentum for the next upward move.
Hence, the bullish rectangle pattern is a powerful continuation pattern that helps traders spot breakout opportunities during an uptrend. Recognizing this pattern can offer strong entry signals, particularly when combined with other technical indicators. In this guide, you’ll learn what a bullish rectangle pattern is, how to identify it, and the best ways to trade it for optimal results.
How to Identify a Bullish Rectangle Pattern
Identifying a bullish rectangle pattern involves several key components:
Established Uptrend: The pattern must occur after a clearly defined uptrend, which sets the context for a potential continuation.
Parallel Support and Resistance Lines: The price oscillates between two horizontal or nearly horizontal boundaries. The support level acts as a floor, preventing prices from falling lower, while the resistance level acts as a ceiling.
Multiple Touchpoints: Ideally, the price should bounce off the support and resistance levels at least twice, creating a visually consistent rectangular range.
Low Volatility During Consolidation: During the rectangle formation, trading volume may decline, indicating indecision in the market.
Breakout to the Upside: A bullish rectangle is only confirmed once the price breaks above the resistance line with strong momentum. This breakout should be accompanied by an increase in trading volume to confirm the validity of the move.
Use trendlines and volume indicators (like the On-Balance Volume or Volume Oscillator) to validate the pattern and reduce the risk of false breakouts.
Bullish Rectangle Pattern Chart Example
In the above chart, you can see how the price consolidates within a rectangle before breaking out in the direction of the prior trend.
How to See It Clearly on the Chart:
Zoom Out for Trend Context: Before identifying the rectangle, zoom out to confirm an existing uptrend. Look for higher highs and higher lows.
Draw Support and Resistance: Use horizontal lines to mark the highest and lowest points during the consolidation phase. The price should move between these levels multiple times.
Look for Symmetry: The highs and lows within the rectangle should be relatively equal in length and duration, giving it a clean rectangular shape.
Observe Volume Behavior: Volume tends to decrease during consolidation and then spike on the breakout. This volume pattern helps differentiate a real breakout from a false one.
Watch for False Breakouts: Sometimes price briefly moves outside the rectangle and re-enters it. These false breakouts often trap traders—wait for a solid candle close above resistance for confirmation.
How to Trade a Bullish Rectangle
Trading the bullish rectangle pattern involves a few strategic steps:
Wait for the Breakout: Only enter a trade after the price breaks above the resistance line.
Confirm With Volume: Volume should spike during the breakout, confirming strength.
Set Entry Point: Place a buy order just above the resistance level.
Stop-Loss Placement: Place a stop-loss slightly below the lower support line to manage risk.
Set Take-Profit Target: Use the height of the rectangle and project it upward from the breakout point to estimate the bullish rectangle pattern target.
Bullish Rectangle Pattern Target Measurement
The projected target after a breakout is generally equal to the height of the rectangle. For example:
Rectangle height = 100 pips
Breakout price = 1.2500
Target = 1.2600
This projection helps traders set realistic and structured take-profit levels.
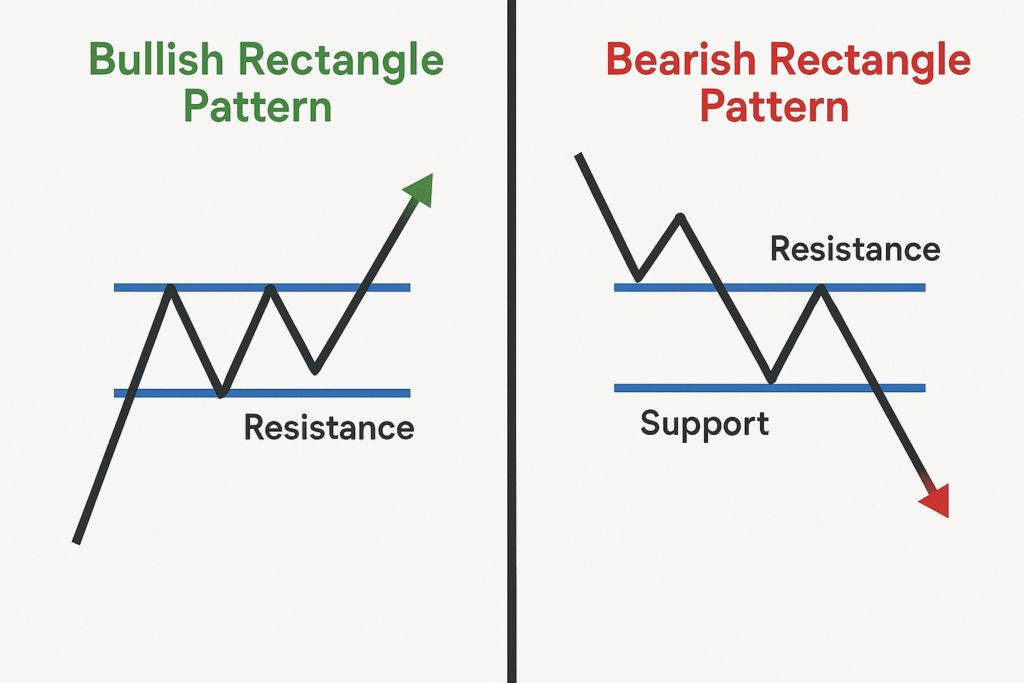
Bullish Rectangle Pattern vs Bearish Rectangle Pattern
Pattern
Trend Direction
Breakout Direction
Signal
Bullish Rectangle
Uptrend
Upward
Buy
Bearish Rectangle
Downtrend
Downward
Sell
Let’s look at an example: EUR/USD Bullish Rectangle.
Imagine the EUR/USD pair is in an uptrend, moving from 1.0850 to 1.1100. After hitting 1.1100, it enters a consolidation range between 1.1070 (support) and 1.1120 (resistance) for several days. The price bounces between these two levels, creating a horizontal rectangle pattern.
During this period, trading volume starts to taper off—a sign that traders are indecisive. Then, suddenly, the price breaks above 1.1120 with a strong bullish candle and a noticeable increase in volume. This breakout confirms the bullish rectangle pattern.
This kind of setup provides a clear and measurable risk-to-reward opportunity.
Conclusion
The bullish rectangle pattern is a reliable continuation signal in forex and stock markets. When properly identified and confirmed with volume, it can present high-probability trading opportunities. Use smart risk management, and always wait for breakout confirmation before entering trades.
Stay ahead of the markets with Ultima Markets’ expert analysis and strategies tailored for every trader. your trusted partner in forex education and trading insights. Stay ahead of the markets with expert analysis and strategies tailored for every trader.
Share Now
Disclaimer:This content is provided for informational purposes only and does not constitute, and should not be construed as, financial, investment, or other professional advice. No statement or opinion contained herein should be considered a recommendation by Ultima Markets or the author regarding any specific investment product, strategy, or transaction. Readers are advised not to rely solely on this material when making investment decisions and should seek independent advice where appropriate.
Thank you for visiting the Ultima Markets website. Please note that this website is intended for individuals residing in jurisdictions where access is permitted by law. Ultima and its affiliated entities do not operate in your home jurisdiction.
By clicking ‘Acknowledge’, you confirm that you are entering this website solely on your own initiative and not as a result of any specific marketing outreach. You wish to obtain information from this website based on reverse solicitation principles, in accordance with the applicable laws of your home jurisdiction.