In Q1 2025, gold prices surged to unprecedented levels, briefly breaking above $3,500 per ounce. This stunning rally was primarily driven by escalating trade tensions, particularly the intensifying U.S.-China conflict, along with growing uncertainty surrounding U.S. fiscal and trade policies. As confidence in traditional safe-haven assets like U.S. Treasuries declined, investors turned to gold as a reliable hedge against volatility and systemic risks.
Following this sharp rally, gold experienced a technical bull-market correction of about 7%, largely due to profit-taking and a short-term shift in sentiment. This pullback is considered a healthy and reasonable correction within an ongoing bull trend. Looking ahead, gold’s medium- to long-term outlook remains firmly bullish, likely to continue into Q2 2025.
Fundamental Support for Gold – A Central Bank Safety Net?
Despite short-term fluctuations that may offer tactical shorting opportunities for traders, the overall trend for gold remains upward. This is underpinned by several key fundamental drivers:
- Ongoing trade uncertainty, especially U.S.-China tariff tensions, fueling persistent risk aversion;
- Supply chain disruptions and rising import costs pushing inflation expectations higher;
- Declining confidence in fiat currencies, particularly the U.S. dollar;
- Robust central bank demand, reinforcing gold’s role as a long-term store of value.
Among these factors, central bank gold purchases stand out as a critical source of confidence for both investors and speculators.
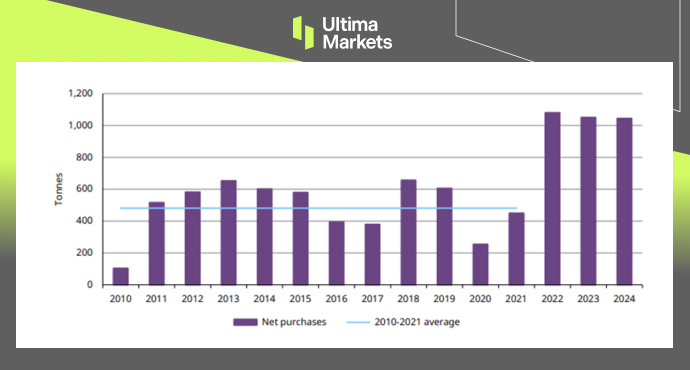
According to the World Gold Council’s 2024 Gold Demand Trends Report, central banks purchased 1,045 tonnes of gold in 2024, marking the third consecutive year of net purchases exceeding 1,000 tonnes. This reflects a structural shift in demand and highlights growing global reliance on gold as a reserve asset.
Gold – 2024 Net Central Bank Purchases; Source: World Gold Council
Notably, 712 tonnes were purchased in the first three quarters of 2024, with an additional 333 tonnes added in Q4, indicating sustained and widespread interest. This steady accumulation by central banks provides a strong fundamental foundation for gold prices and aligns with key technical support zones.
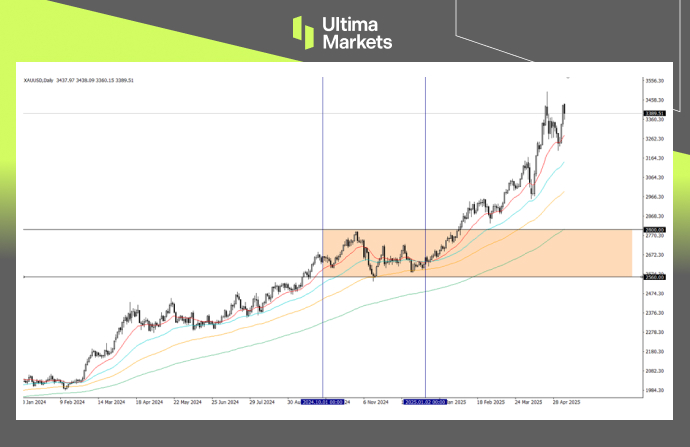
Gold Daily Chart; Source: Ultima Market MT5
Looking back at Q4 2024, gold traded within a range of $2,600 to $2,800 per ounce. Based on the World Gold Council’s data, the bulk of central bank buying occurred within this price range, suggesting that $2,600–$2,800 has become a structurally important support zone—a price floor effectively underpinned by central bank activity.
Given the scale and consistency of these purchases, this zone is likely to serve as a major price support level in the future.
The $3,000 Gold Era Begins
As gold breaks above the critical $3,000 mark and stabilizes above it, the market may be witnessing the beginning of a new trading era—the “$3,000 gold era.” This key level not only carries significant psychological weight but could also form a future support base.
The significance of this breakout is comparable to gold surpassing $1,500 in 2020 and breaching $2,000 in early 2024—each event triggered a structural shift in long-term trends, underscoring gold’s ongoing structural upside.
As we move through the first half of 2025, gold continues to maintain a bullish medium- to long-term trend. Although temporary pullbacks may occur due to shifts in market sentiment—particularly if trade tensions temporarily ease—these tactical corrections do not alter the overall upward trajectory.
Three Key Drivers Supporting Gold’s Long-Term Bull Case:
- Central Bank Accumulation: Ongoing purchases within the $2,600–$2,780 range establish strong structural support.
- The $3,000 Milestone: As seen with prior breakthroughs at $2,000, successfully holding above $3,000 could signal the formation of a new long-term price platform.
- De-dollarization by BRICS Nations: The BRICS bloc is accelerating efforts to reduce dependence on the U.S. dollar, positioning gold as a core strategic reserve asset and boosting long-term demand.
Gold Technical Outlook: Key Levels in Focus
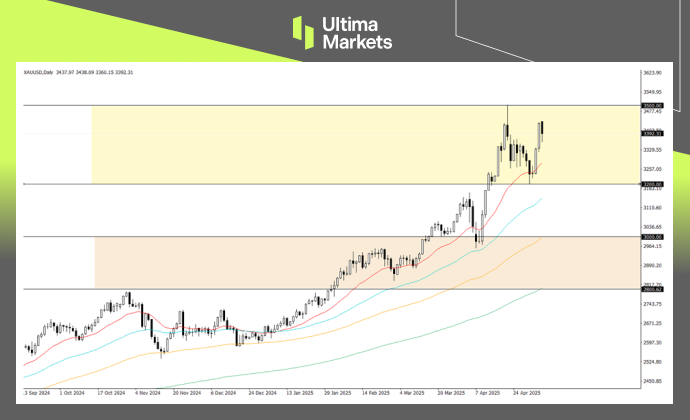
From a long-term technical perspective, $3,000 is a critical psychological threshold. If gold can hold this level, it will reinforce the market consensus that we’ve entered the “$3,000 era.” At the same time, the $2,800 zone remains a solid structural support level, primarily backed by consistent central bank buying—providing a price floor.
Gold Key Price Levels – Daily Chart; Source: Ultima Markets MT5
In the medium term, $3,200 has become a pivotal level. As long as prices remain above this, the bullish trend remains intact. However, a break below $3,200 could trigger a deeper correction, potentially testing the $3,000 support level.
Should gold fall below the $3,000 support, it may signal the onset of a more prolonged bearish phase or structural correction. Nonetheless, $2,800 is expected to act as a major downside buffer, underpinned by steady official-sector demand.
Such a scenario is more likely only if market confidence deteriorates significantly or investors shift decisively toward higher-yielding assets, weakening gold’s appeal as a safe haven.
Disclaimer
Comments, news, research, analysis, price, and all information contained in the article only serve as general information for readers and do not suggest any advice. Ultima Markets has taken reasonable measures to provide up-to-date information, but cannot guarantee accuracy, and may modify without notice. Ultima Markets will not be responsible for any loss incurred due to the application of the information provided.