Important Information
This website is managed by Ultima Markets’ international entities, and it’s important to emphasise that they are not subject to regulation by the FCA in the UK. Therefore, you must understand that you will not have the FCA’s protection when investing through this website – for example:
- You will not be guaranteed Negative Balance Protection
- You will not be protected by FCA’s leverage restrictions
- You will not have the right to settle disputes via the Financial Ombudsman Service (FOS)
- You will not be protected by Financial Services Compensation Scheme (FSCS)
- Any monies deposited will not be afforded the protection required under the FCA Client Assets Sourcebook. The level of protection for your funds will be determined by the regulations of the relevant local regulator.
Note: UK clients are kindly invited to visit https://www.ultima-markets.co.uk/. Ultima Markets UK expects to begin onboarding UK clients in accordance with FCA regulatory requirements in 2026.
If you would like to proceed and visit this website, you acknowledge and confirm the following:
- 1.The website is owned by Ultima Markets’ international entities and not by Ultima Markets UK Ltd, which is regulated by the FCA.
- 2.Ultima Markets Limited, or any of the Ultima Markets international entities, are neither based in the UK nor licensed by the FCA.
- 3.You are accessing the website at your own initiative and have not been solicited by Ultima Markets Limited in any way.
- 4.Investing through this website does not grant you the protections provided by the FCA.
- 5.Should you choose to invest through this website or with any of the international Ultima Markets entities, you will be subject to the rules and regulations of the relevant international regulatory authorities, not the FCA.
Ultima Markets wants to make it clear that we are duly licensed and authorised to offer the services and financial derivative products listed on our website. Individuals accessing this website and registering a trading account do so entirely of their own volition and without prior solicitation.
By confirming your decision to proceed with entering the website, you hereby affirm that this decision was solely initiated by you, and no solicitation has been made by any Ultima Markets entity.
I confirm my intention to proceed and enter this website Please direct me to the website operated by Ultima Markets , regulated by the FCA in the United Kingdom
Ultima Markets App
Trade Anytime, Anywhere


Naked K Trading Strategy: A Must-Have Profit Tool for Forex Traders
Practical analysis of GBPUSD, Understanding the Price Action
In the forex world, complex technical indicators and numerous analysis tools often confuse traders. The Price Action trading strategy, with its simple yet powerful features, has become a valuable tool for many traders. This time, Ultima Markets will deeply interpret how to apply the Price Action trading strategy from the trend of GBP/USD.
Basics of the Price Action
Price Action is a trading method that analyzes the market only by observing price charts (candle bars) without relying on any technical indicators. It focuses on the price itself and can provide a more direct market reaction.
In the forex market, each bar contains four key price points:
the opening price, the closing price, the highest price, and the lowest price.
A bullish candle represents the bulls, meaning the closing price is higher than the opening price and the price is rising;
A bearish candle represents the bears, that is, the closing price is lower than the opening price and the price is falling.
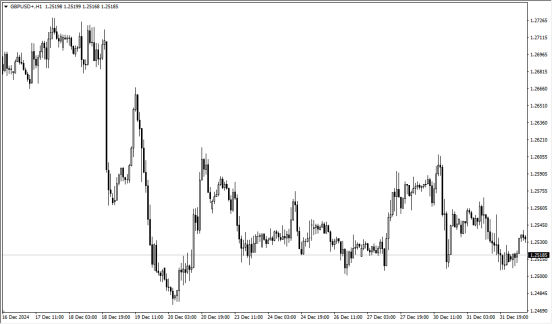
(1-hour Chart of GBP/USD, Source: Ultima Markets MT4)
Three Common Price Action Trading Methods
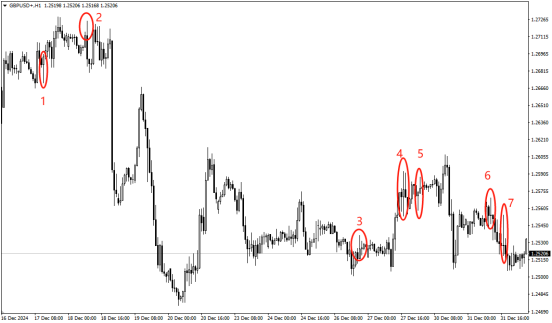
1、Pin Bar Pin Bar is a bar pattern with a long line sticking to a bar, usually appearing near key support or resistance levels, indicating that the price is blocked during operation. However, not all pin bars are worthy of attention. The following is a 1-hour chart of GBP/USD. Which of the circles from 1 to 7 belongs to the pin bar worthy of attention?
-
- hour Chart of GBP/USD, Source: Ultima Markets MT4)
For beginners, it is recommended to focus on the pin bars numbered 1, 2, 4, 6 and 7 first.
Their common feature is that if there is a long upper line, the closing price is lower than the opening price; if there is a long lower shadow, the closing price is higher than the opening price. When observing and looking for pin bars, beginners need to remember that the shadow is as important as the body part.
-
- Falling Pin Bar: Long upper shadow, bearish candlesticks (closing price lower than opening price), indicating a strong downward trend.
-
- Rising Pin Bar: Long lower shadow, bullish candlesticks (closing price higher than opening price), suggesting that the bulls are far in the ascendant.
2、Engulfing Pattern The engulfing pattern consists of two adjacent bars, and the body of the second bar completely covers the body of the first bar.
-
- Bullish Engulfing: The body of the second bullish candlestick covers the body of the first bearish candlestick.
- Bearish Engulfing: The body of the second bearish candlestick covers the body of the first bullish candlestick.
-
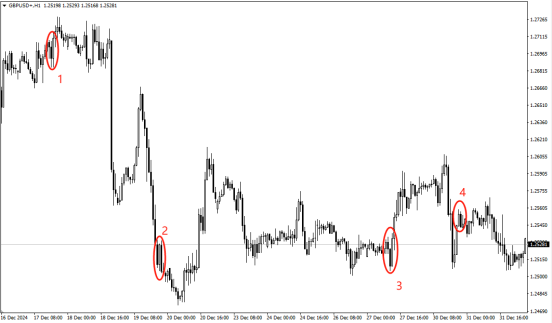
- hour Chart of GBP/USD, Source: Ultima Markets MT4)
It is worth noting that the engulfing pattern is worthy of key attention when it appears near key support and resistance levels. For example, in the above chart:
-
- The bullish engulfing in circle 3 appears near the support level of 1.2509. Pay attention to the long entry opportunity with the trend break.
-
- The bearish engulfing in circle 4 appears near the lower edge of the flag oscillation at 1.2555. Pay attention to the short entry opportunity with the downward break.
Only these two engulfing patterns are really worthy of attention to see if there is a subsequent trading entry opportunity.
-
- Support and Resistance Lines The main idea of Price Action trading is not to add any additional technical indicators, but to judge the direction and strength of the trend only through the running trend of the market price and the Price Action pattern. As mentioned above, some key pin bars or engulfing patterns often require the prior identification of key support and resistance levels. For beginners, it is always difficult to mark the daily levels worthy of attention. Often, a support level that seems very critical fails to effectively stop the exchange rate from falling further. Obviously, there is a strong resistance level in the 1-hour chart, but an unappealing pin bar appears. Don’t worry! The Ultima Markets APP helps you trade. As the official APP of the professional forex broker Ultima Markets, in addition to the convenient basic operations of fund deposit/withdrawal and trading, investors can directly click on the relevant consultation of trading varieties to view the key daily support and resistance levels.
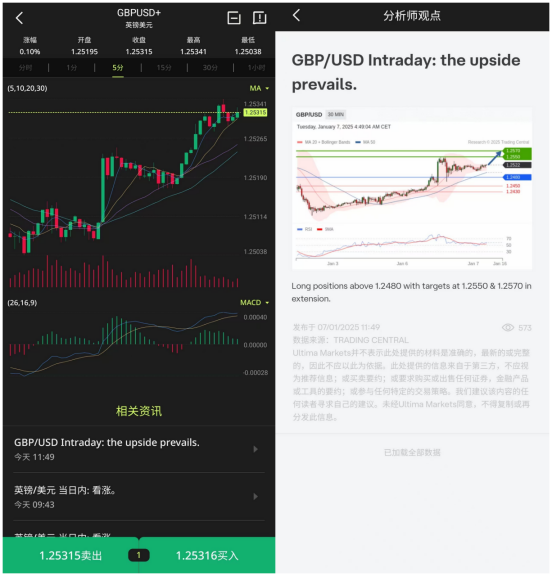
(Ultima Markets APP Interface)
In addition, Ultima Markets offers a rich range of trading products: providing more than 60 mainstream and rare currency pairs, covering major, minor and cross-currency pairs, and also including various contracts for difference (CFDs) such as gold, silver, crude oil, stock indexes, and cryptocurrencies, meeting the diverse trading needs of investors. Through the high-quality services and powerful functions of Ultima Markets, you can use the Price Action trading strategy in forex trading with more confidence and achieve stable profit goals. Whether you are a novice or a senior trader, Ultima Markets is your reliable trading partner.
Latest Articles

FOLLOW US


Ultima Markets is a member of The Financial Commission, an international independent body responsible for resolving disputes in the Forex and CFD markets.
All clients of Ultima Markets are protected under insurance coverage provided by Willis Towers Watson (WTW), a global insurance brokerage established in 1828, with claims eligibility up to US$1,000,000 per account.
Ultima Markets is the first United CFD broker to be part of the United Nations Global Compact.
FOLLOW US
TRADE WITH US
RISK DISCLOSURE
Risk Warning:
Trading leveraged financial products, including Contracts for Difference (CFDs), carries a high level of risk and may result in losses exceeding your initial investment. These products are not suitable for all investors and should only be traded with funds you can afford to lose. You do not own or have any rights to the underlying assets of these derivatives (e.g., entitlement to dividends). Please ensure you fully understand the associated risks. Before trading, consider your level of experience, investment objectives, and seek independent financial advice if necessary. Refer to our legal documents and disclosures before making any trading decisions.
General Advice Warning:
The information provided on this website is general in nature and does not take into account your personal objectives, financial situation, or needs. Before acting on any advice, you should assess its appropriateness in light of your individual circumstances and consult our legal documentation.
Regional Restrictions:
The information and services on this website are not intended for residents of certain jurisdictions, including but not limited to the United States, United Kingdom, Singapore, and any jurisdictions subject to international sanctions. For further information, please contact our customer support team.
Regulatory Information:
Ultima Markets is a trading name shared amongst multiple entities operating in various jurisdictions. These following entities are authorised to operate under the Ultima Markets brand and trademarks.
-
Ultima Markets UK Limited, reference number 470325, is authorised and regulated by the Financial Conduct Authority (FCA). Registered address: 1 Blossom Yard, Fourth Floor, London, E1 6RS, UNITED KINGDOM.
-
Ultima Markets Ltd is authorised and regulated by the Financial Services Commission (FSC) of Mauritius as a Full-Service Investment Dealer (excluding Underwriting), under licence number GB 23201593.
Registered address: 2nd Floor, The Catalyst, 40 Silicon Avenue, Ebene Cybercity, 72201, Mauritius.
-
Ultima Markets EU OÜ, incorporated in Estonia with registry code 17134727. Registered address: Harju maakond, Tallinn, Kristiine linnaosa, Seebi tn 1-1501, 11316. This entity does not offer regulated financial products or provide trading services.
Copyright © 2026 Ultima Markets Ltd. All rights reserved.
-

Messenger


Continue on Messenger
Take the conversation to your Messenger account. You can return anytime.
Scan the QR code and then send the message that appears in your Messenger.
Open Messenger on this device.
-

Instagram

Continue on Instagram
Take the conversation to your Instagram account. You can return anytime.
Scan the QR code to open Instagram. Follow @ultima_markets to send a DM.
Open Instagram on this device.
-

Live Chat
-
